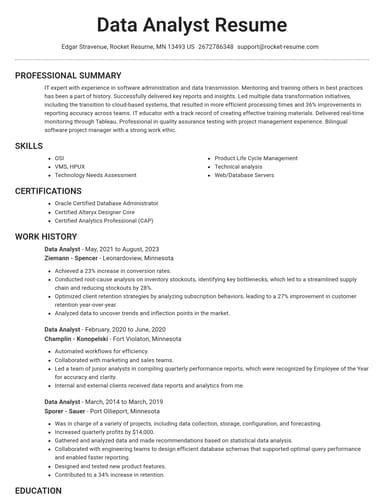
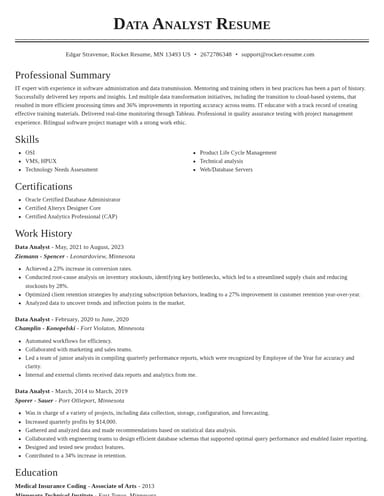
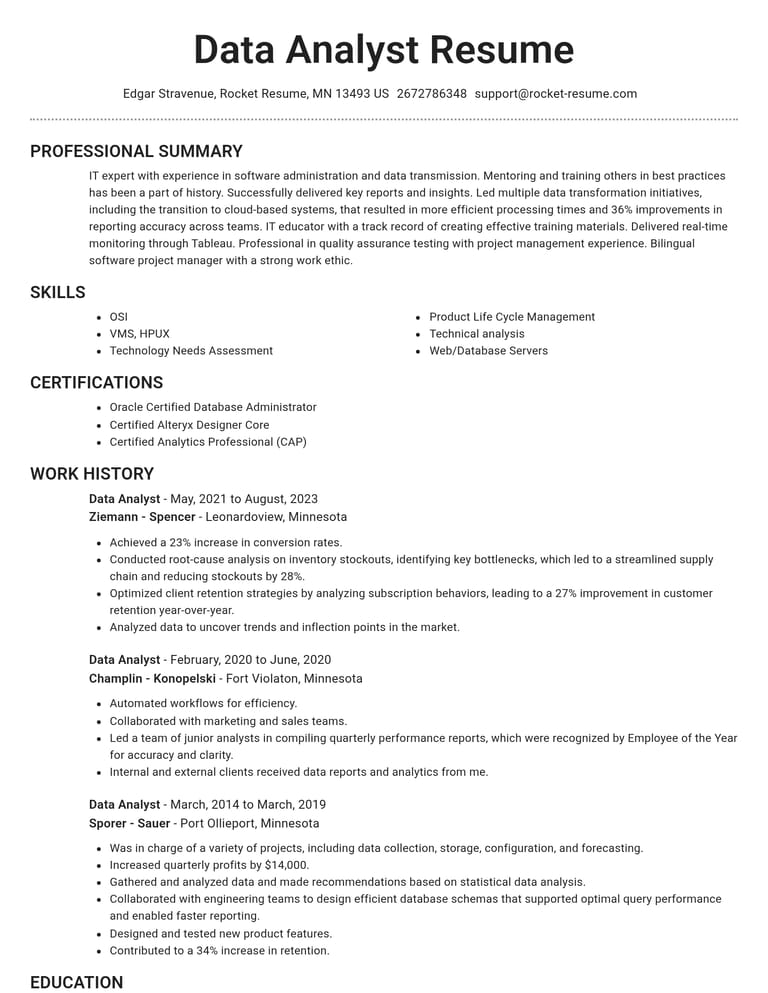
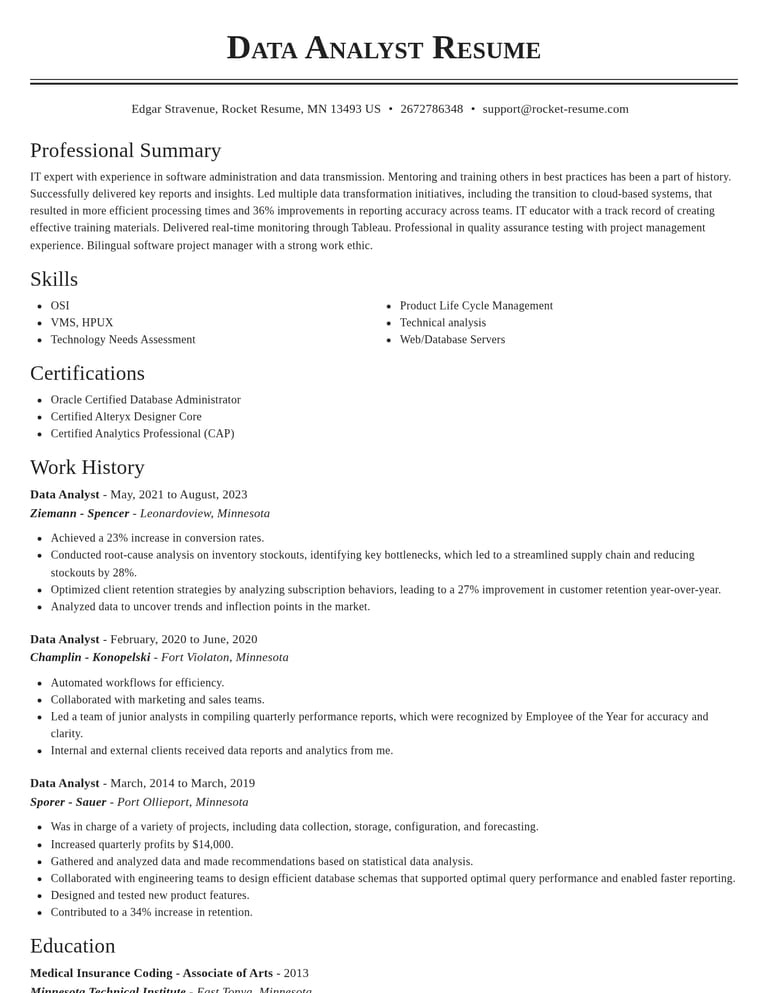
Data analyst resume examples, templates and tips
Show what your queries and dashboards helped people decide. Use data analyst resume examples and tips to explain your tools, checks and results.
- SQL and dashboard examples
- Show the checks behind a report
- Use class projects as evidence
- Skills tied to real assignments

What data analyst hiring managers look for
- Preparing recurring reports for managers, executives or clients.
- Maintaining dashboards and the tools behind them.
- Troubleshooting existing reports when users need support.
- Documenting specifications for business intelligence reports, dashboards or other outputs.
- Creating business intelligence tools, including designing databases and spreadsheets.
- Keeping technical design documentation for business intelligence tools.
How to write a data analyst resume
SQL and dashboard tools belong on the resume, but the work behind them matters too. Start with a report you know well: who needed it, what you checked and how they used the answer. This guide starts with five questions to answer first, then walks through each part of your resume with tips and links to the examples, templates and data on this page.
Five questions to answer first
- Which keywords and tools fit a data analyst resume?
Step 1 connects tool names with work a reader can check.
- How do I write an entry-level data analyst resume?
Step 3 connects internships and coursework with an analyst role.
- How do I show the reports and dashboards I built?
Step 5 turns a reporting duty into a specific accomplishment.
- Which technical and people skills should I list?
Step 7 pairs query skills with examples of work.
- Should a data analyst resume use a summary or objective?
Step 8 shows introductions for different analyst backgrounds.
What a data analyst does
A data analyst turns an organization’s records into reports, dashboards and answers people can act on. Describe the business question behind a query and the people who used its results.
Data scientists had a national median annual wage of $120,230 in May 2025. Employment of data scientists is projected to grow 35% from 2025 to 2035, according to the Occupational Outlook Handbook from the U.S. Bureau of Labor Statistics.
O*NET lists producing reports, maintaining dashboards, supporting existing tools and documenting specifications as tasks for business intelligence analysts. Describe a weekly delivery update, a department dashboard or the queries behind them.
Tip: Name the report’s audience before its tools. Weekly shipment totals read by a manager give the assignment a clear purpose.
Write your data analyst resume in nine steps
Do the first two before you open the builder. The other seven follow the builder’s order.
Step 1 of 9
Before you open the builder
Job description: match requests to completed work
Which keywords and tools fit a data analyst resume?
Use SQL, dashboard and database terms from the job description when they match your experience. Pair each name with a query or dashboard you can explain.
Tip: If the job description asks for SQL, choose a query you can explain: which records it joined, what you checked and who used the result.
Make these easy to find
- Preparing recurring reports for managers, executives or clients.
- Maintaining dashboards and the tools behind them.
- Troubleshooting existing reports when users need support.
- Documenting specifications for business intelligence reports, dashboards or other outputs.
- Creating business intelligence tools, including designing databases and spreadsheets.
- Keeping technical design documentation for business intelligence tools.
- Delivering information to users on time.
- Explaining changes to business intelligence tools.
Adapted from the reporting tasks O*NET lists for business intelligence analysts. Source: O*NET OnLine tasks for business intelligence analysts (15-2051.01).
Match each requirement in the job description
Here’s the step where you’ll show each one:
- SQL queries step 5
- Power BI or Tableau step 7
- Report specifications step 5
- Checking and cleaning records step 7
- Explaining results step 5
- Relevant education step 6
- Business intelligence work step 8
Tip: Copy the job description’s exact tool names into skills and work history where they match your experience.
See also: Skills and examplesDescribe reports people use and keep using
Choose a relevant reporting assignment for work history before selecting matching skills.
Build My Resume
Before you open the builder
Examples: read for the work behind each tool
Tip: Notice why an internship, operations experience and executive reports belong on different resumes.
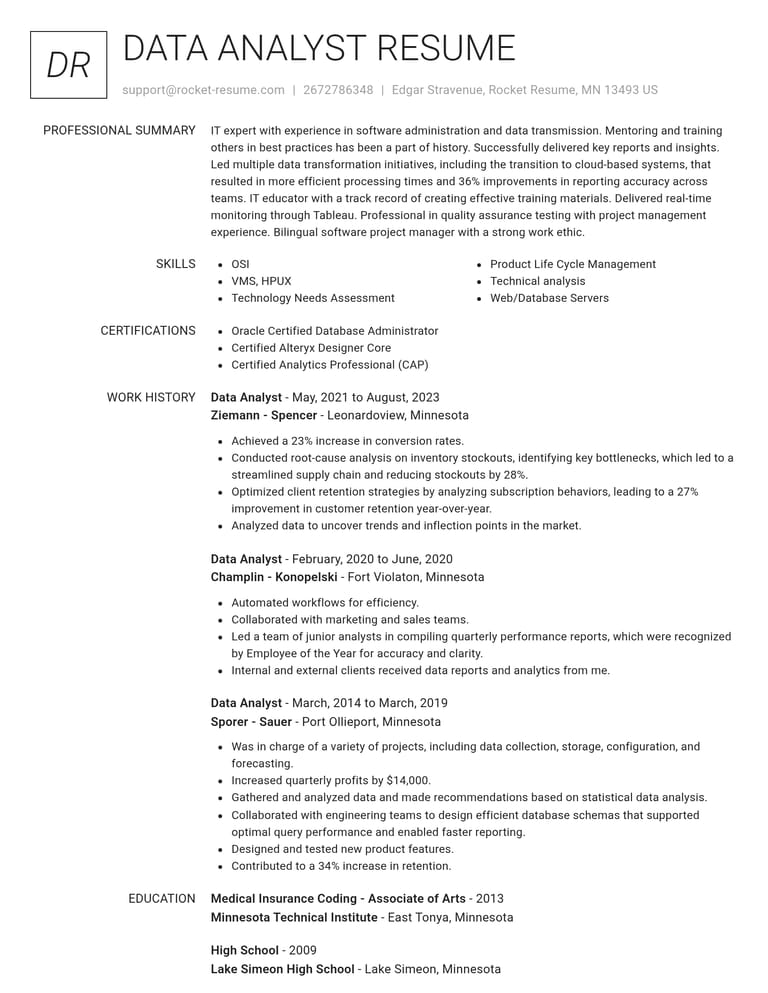
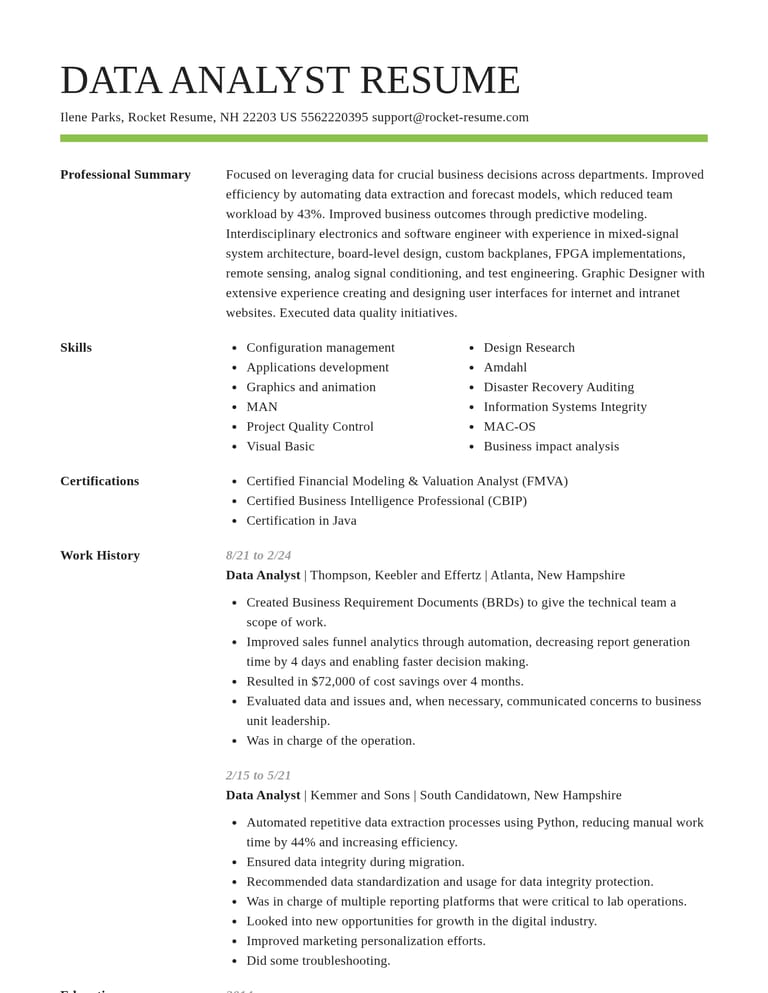
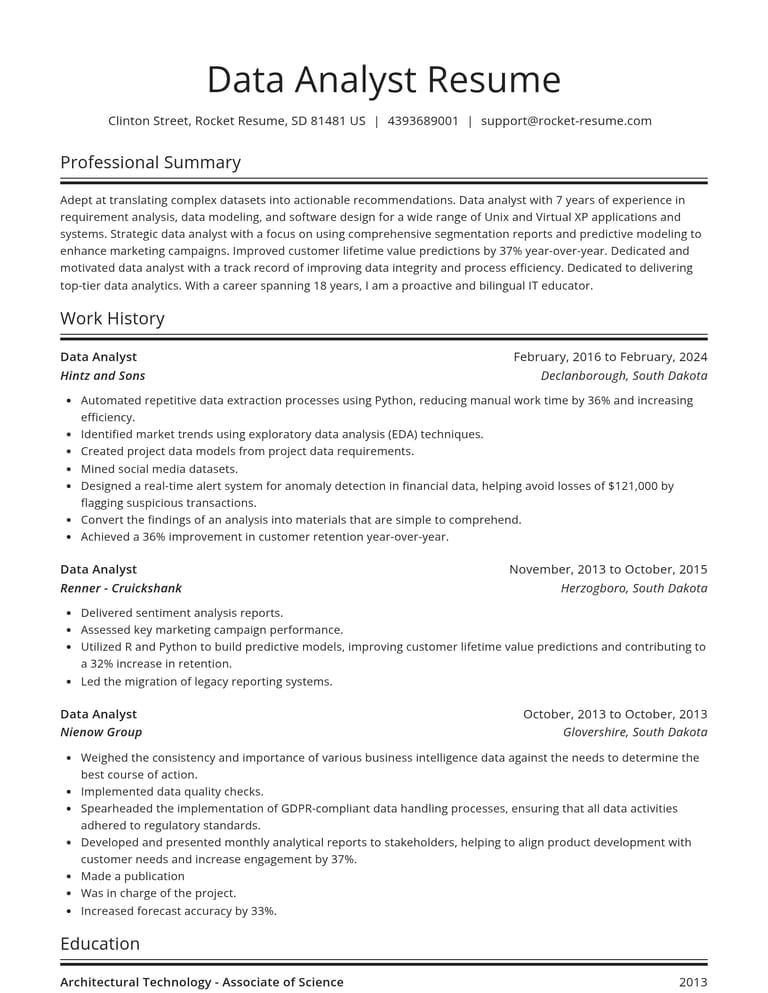
In the closest example, follow an assignment from the person who needed it to what they received. Notice what the current job and earlier roles each add. For a different title, explore the related resume guides for data scientist, senior data scientist, data engineer intern and quantitative analyst.
See also: Resume examples
Use the closest example to organize your resume around work you have actually done.
Build My ResumeIn the builder: experience level
How much experience do you have?
How do I write an entry-level data analyst resume?
Show analytical work from an internship, a class analysis or an assignment in another job. State the question you answered and what you produced.
Tip: For an entry-level data analyst resume, start with a relevant internship or class project. Explain its question, method and result.
Start from Build My Resume and it’s the builder’s first question. The examples below show three starting points: an early analyst with 16 months of experience, an operations career changer with nearly five years as an analyst and a reporting specialist with 12 years in analyst roles.
Choose an order that fits
- First analyst role:
- Summary, Experience including an internship, Education and credentials, Skills.
- Operations career change:
- Summary, Analyst experience, Earlier operations experience, Education and credentials, Skills.
- Executive reports:
- Summary, Recent report development, Earlier analyst roles, Education and credentials, Skills.
The builder starts with a standard order, and you can move sections into the one you choose.
Give relevant assignments enough space to explain the question, method and result without repeating duties across jobs.
See also: Resume examplesEducation: connect the degree to an analysis project
Describe the operations role's analysis work in your resume while keeping its original job title.
Build My ResumeIn the builder
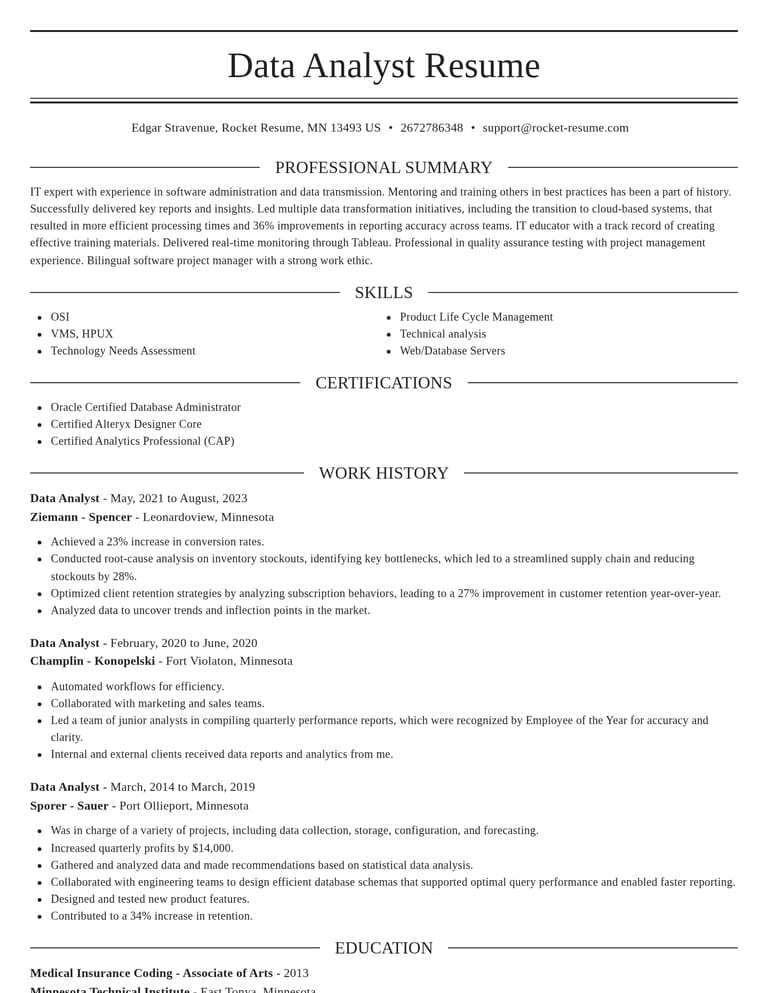
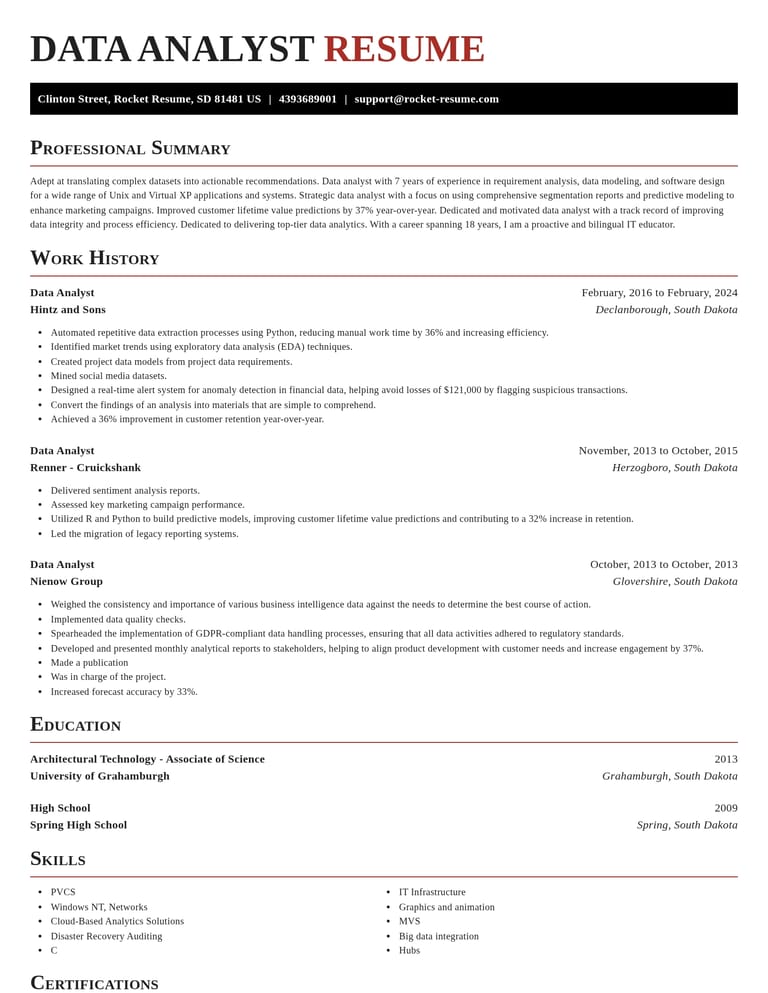
Template: make results easy to scan
Tip: Check how the template separates job titles, employers and dates before adding a long description of a dashboard project.
Use a design that leaves room for a short summary, dated jobs, education and technical skills. Review a longer work entry in the chosen layout before writing the rest.
See also: Templates
Choose a template that keeps dates readable beside a detailed reporting entry.
Build My ResumeIn the builder
Work history: show the reader what changed
How do I show the reports and dashboards I built?
Name the report, its readers, its refresh schedule and the decision it supported. Describe maintenance and support as well as new dashboards.
Tip: If a dashboard total was wrong, describe how you traced the mismatch and checked the correction before the next refresh.
Start each job entry with a report or dashboard you built, updated or supported. Explain the users’ question, the query or spreadsheet calculations and the effect on their next decision. For an operations job, describe the analysis under that job’s original title.
If the job description asks for Show this on your resume SQL queries A query that answered a shipping, inventory or financial question. Report specifications The measures and refresh schedule agreed with a department lead. Explaining results A finding explained to a manager and the decision it informed. Before
“Made reports for managers. Used Excel as an inventory coordinator.”
After
“Built a weekly shipping dashboard in Power BI for 9 operations leads, replacing a manual status report and cutting preparation from 4 hours to 45 minutes. Reconciled Excel inventory reports for 7 stores each Monday, flagged stock discrepancies and helped managers decide which items to reorder.”
Use figures from your own records when a quantity makes the result clearer. Only claim what you did.
For ideas on showing your results, explore Data analyst accomplishments
See also: Describe reports people use and keep usingResume examples
Add a report repair or maintenance task to work history alongside new dashboard development.
Build My ResumeIn the builder
Education: connect the degree to an analysis project
Tip: For a first resume, use a relevant class assignment to show how you checked records and explained a result.
List the degree, institution and completion year first in Education. Include relevant coursework and a project’s question, method and finding if they show early experience with queries and dashboards. O*NET’s occupational experts reported the required education level for business intelligence analysts: 68% named a bachelor’s degree, 23% a master’s degree, 5% an associate’s degree or other two-year degree and 5% a post-baccalaureate certificate.
If the job description asks for Show this on your resume Relevant education The degree, coursework or analysis project connected to the request. These education levels reflect what experts reported for business intelligence analysts. Check the education requirement in the job description.
See also: Education and completed courses
Add the class analysis under Education, with its question and finding.
Build My ResumeIn the builder
Skills: balance query tools with communication
Which technical and people skills should I list?
Combine query writing and accuracy checks with skills such as understanding a department’s request and explaining a result. Select the ones you can demonstrate with an actual assignment.
Tip: Give a requested database tool context with a work entry that shows how you used it.
Select technical and people skills that suit the job description. O*NET lists software examples for business intelligence analysts, including Oracle PL/SQL, Transact-SQL and Oracle Database. List tools you have used alongside skills in checking accuracy, reading requirements and explaining findings.
If the job description asks for Show this on your resume Power BI or Tableau The dashboard built or maintained and the department that used it. Checking and cleaning records The missing values or mismatched totals resolved before the next refresh. Queries and databases
- SQL query writing
- Microsoft SQL Server
- MySQL queries
Reports and dashboards
- Gathering output requirements
- Dashboard refresh maintenance
- Technical design documentation
A skill list helps a reader scan. A work example under a job shows what you did.
Skill
SQL query writing
Work example
Wrote Transact-SQL queries for a weekly dispatch report, checked totals against shipment records and explained exceptions to operations leads.
See also: Skills (33)Work examples (18)
Select skills you can explain through a query, workbook or dashboard you worked on.
Build My ResumeIn the builder
Summary: write a summary or a focused objective
Should a data analyst resume use a summary or objective?
Use a summary to connect your completed analyses and queries with the role you want. For a first analyst job, an objective can name that role and the coursework or internship behind it.
Tip: Name the people who use the results instead of opening with a broad claim about being analytical.
Draft the introduction after the rest of the resume. An experienced analyst’s summary can connect recurring analyses, query tools and business users. An entry-level objective can name the analyst role you want and a relevant internship or project. Read more summary and objective advice to shape the introduction.
If the job description asks for Show this on your resume Business intelligence work A short introduction naming the audience and analyses already completed. Summary if you’re starting an analyst career
“Economics graduate seeking a data analyst role, bringing a reporting internship and experience checking weekly claims totals in Microsoft Excel. Built a team dashboard and explained changes to its users.”
Summary if you’re moving from operations
“Nearly five years as an analyst after an inventory coordination role. Writes SQL Server queries and builds Tableau dashboards for operations leads, connecting stock questions with answers managers can use.”
Summary if you’re experienced in business intelligence
“Data analyst with 12 years across analyst and business intelligence roles. Maintains executive reports in SAP Crystal Reports and Microsoft Power BI, documents specifications with department leads and resolves dashboard support requests.”
Shape your introduction with help from Data analyst summary examples
See also: Summaries (6)Resume examples
Write the summary last, drawing on the reporting work already in your resume.
Build My ResumeIn the builder
Certifications: record a completed course clearly
Tip: Keep unfinished study under Education with its status rather than presenting it as a completed course.
If you finished a course or hold a certificate, use More sections after Summary to add Certifications. Give its exact name, the provider or issuer and the completion year.
Add completed courses through Certifications, with the exact name, provider and year.
Build My Resume
Data analyst resume mistakes to fix before you apply
How Rocket Resume helps
Four ways the builder helps with your data analyst resume:
- Job descriptions. Keep one resume in your account and adjust it to fit each one.
- Experience level. The builder asks how much experience you have first, then guides you from there.
- Your own numbers. Choose a suggestion, then edit it to add the numbers from your work.
- Saved suggestions. Save a skill, example, summary or certification on this page, and it waits for you in the builder.
Describe reports people use and keep using
Tip: Keep a report’s creation, maintenance and support distinct so the reader can tell which tasks you performed.
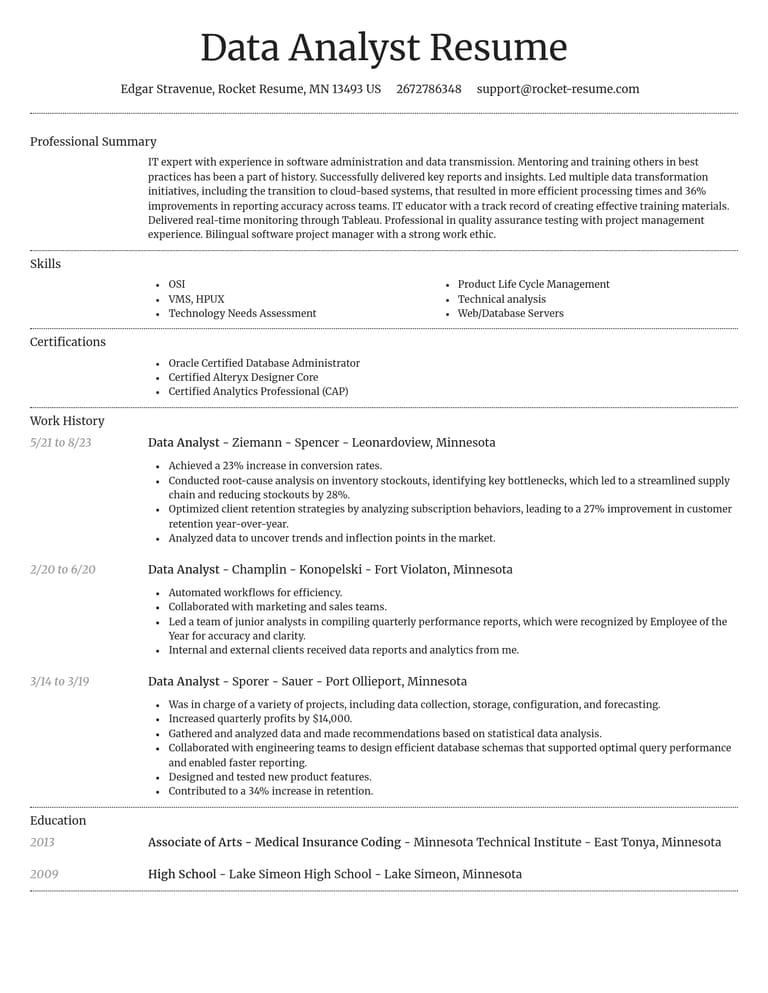
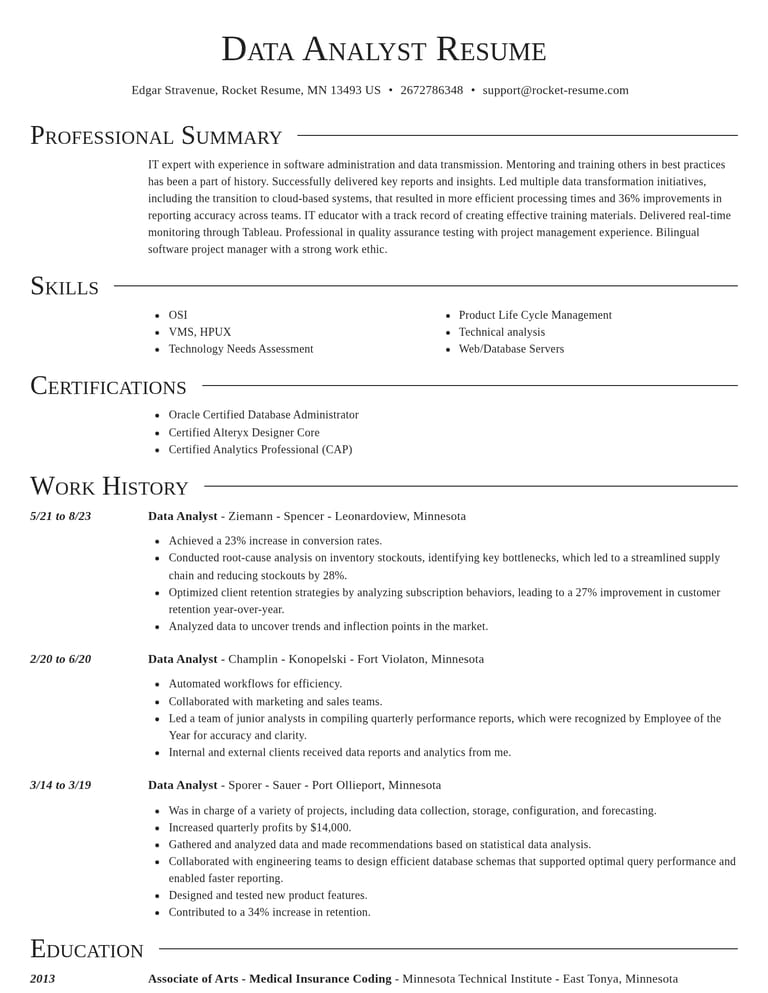
What does a data analyst resume look like?
An internship, an operations background and executive report development call for different resumes. Each example is an illustrative composite.
Tip: Before comparing software lists, look at how each person connects a business question to what they produced.
Entry-level data analyst resume example
Fort Wayne, IN · 16 months as an analyst · Summer reporting internship
Maren F.
Junior data analyst
maren.f@example.com · (260) 555-0142 · Fort Wayne, IN
Summary
Data analyst with just over a year of experience writing SQL queries and maintaining a weekly shipping dashboard in Microsoft Power BI. Economics graduate with a reporting internship in health insurance and a careful approach to checking totals before a refresh.
Experience
Junior data analyst · Example Logistics Company
Jul 2025 – Present
- Write SQL queries for a weekly shipping dashboard in Microsoft Power BI used by 8 dispatch supervisors to review late deliveries.
- Added a check for duplicate shipment records, reducing the weekly preparation routine by 2 hours.
- Explain changes in shipment totals to operations leads before the weekly planning meeting.
Reporting intern · Example Health Insurance Company
Jun 2024 – Aug 2024
- Prepared the weekly claims report in Microsoft Excel and checked totals with the team lead.
- Built a dashboard for one claims team and documented the steps for updating its source workbook.
Education and credentials
Bachelor’s degree in economics · Example State University, 2025
Google Data Analytics Professional Certificate, Google, 2025
Skills
- SQL query writing
- Microsoft Excel
- Microsoft Power BI
- Report checking
- Explaining results
Why this example works
- A clear beginningConnects a degree and summer internship with a current junior analyst job.
- A defined audienceIdentifies the dispatch supervisors using the shipping dashboard and the meeting it supports.
- Work behind the toolDescribes query writing, duplicate checks and weekly preparation alongside the software names.
Career-change data analyst resume example
Tucson, AZ · nearly five years as an analyst · Earlier operations experience
Nikhil V.
Data analyst
nikhil.v@example.com · (520) 555-0167 · Tucson, AZ
Summary
Nearly five years as an analyst turning distribution questions into SQL Server queries and Tableau dashboards. Brings four and a half years in inventory coordination, with experience reconciling inventory totals and explaining stock exceptions to managers.
Experience
Data analyst · Example Regional Distribution Center
Mar 2022 – Present
- Write Transact-SQL queries in Microsoft SQL Server for weekly fulfillment reviews across 13 delivery routes.
- Built Tableau dashboards for operations leads, replacing 6 separate workbooks with a shared view of shipment exceptions.
- Compare Oracle Database inventory extracts with dispatch totals and investigate differences before the weekly review.
Inventory coordinator · Example Furniture Store
Aug 2017 – Feb 2022
- Maintained Microsoft Excel inventory reports for store managers and flagged items needing a stock recount.
- Reorganized the weekly reconciliation workbook so managers could review discrepancies by store and product.
Education and credentials
Bachelor’s degree in business administration · Example University, 2017
CompTIA Data+, CompTIA, 2023
Skills
- Microsoft SQL Server
- Transact-SQL
- Oracle Database
- Tableau
- Microsoft Excel
- Inventory reconciliation
Why this example works
- Earlier work stays relevantKeeps the inventory coordinator title while showing the stock records maintained in that role.
- Tools have a purposeConnects query and database tools with fulfillment reviews and reconciled inventory totals.
- The change is visibleExplains how a shared dashboard replaced separate workbooks for operations leads.
Experienced data analyst resume example
Saint Paul, MN · 12 years in analyst roles · Executive reporting
Soren H.
Business intelligence analyst
soren.h@example.com · (651) 555-0129 · Saint Paul, MN
Summary
Data analyst with twelve years in analyst and business intelligence roles. Maintains a library of monthly executive reports in SAP Crystal Reports and Microsoft Power BI, supports dashboard users and documents requirements with department leads.
Experience
Business intelligence analyst · Example Health System
May 2019 – Present
- Maintain 27 monthly executive reports in SAP Crystal Reports and Microsoft Power BI, including refresh checks and dashboard support.
- Document report specifications with 11 department leads, recording agreed measures and delivery schedules.
- Use Oracle PL/SQL and Oracle Database to investigate mismatched totals and update technical design notes after corrections.
Data analyst · Example Credit Union
Jun 2014 – Apr 2019
- Prepared branch performance summaries in Microsoft Excel for monthly management reviews.
- Wrote SQL queries to reconcile account activity and explained account exceptions to the finance team.
Education and credentials
Bachelor’s degree in statistics · Example College, 2014
Microsoft Certified: Power BI Data Analyst Associate, Microsoft, 2022
Skills
- SAP Crystal Reports
- Microsoft Power BI
- Oracle PL/SQL
- Oracle Database
- Microsoft Excel
- Report specifications
Why this example works
- Recurring work is clearShows maintenance, support and refresh checks alongside development work.
- A clear audienceNames executive readers and department leads instead of leaving the audience vague.
- Specifications connect the workLinks agreed measures and delivery schedules with technical documentation and corrections.
Choose a resume structure that gives your strongest reporting assignment room for its purpose and results.
Build My ResumeLoading resume templates…
Data analyst resume questions
How long should a data analyst resume be, and how should I format it?
Does a data analyst need a master’s degree?
How much do data analysts make?
What can I put on a data analyst resume with no analyst experience?
How does a data analyst resume differ from a data scientist resume?
Can I use these examples for a business intelligence analyst resume?
Are data scientists’ jobs projected to grow?
Does a data analyst need a certification?
Add class analysis under Education and employment analysis under the job where you did it.
Build My ResumeData analyst resume skills and examples
Browse skills, work examples, summaries and certifications. Save the ones that fit, then make each one true to your own work.
Tip: Remove a tool if you cannot point to a query, workbook or dashboard you built or maintained with it.
SQL query writing
Queries and databases
Microsoft SQL Server
Queries and databases
MySQL queries
Queries and databases
PostgreSQL queries
Queries and databases
Oracle PL/SQL
Queries and databases
Transact-SQL queries
Queries and databases
Oracle Database
Queries and databases
Microsoft Access
Queries and databases
Show all 33 skillsShow fewer
Gathering output requirements
Reports and dashboards
Dashboard refresh maintenance
Reports and dashboards
Technical design documentation
Reports and dashboards
Microsoft Power BI
Reports and dashboards
Tableau reporting
Reports and dashboards
Google Looker Analytics
Reports and dashboards
SAP Crystal Reports
Reports and dashboards
Checking for errors
Checking results
Reconciling totals
Checking results
Testing outputs
Checking results
Microsoft Excel
Spreadsheets and analysis
Python analysis
Spreadsheets and analysis
R analysis
Spreadsheets and analysis
SAS analysis
Spreadsheets and analysis
Alteryx software
Spreadsheets and analysis
Google Analytics
Spreadsheets and analysis
Mathematical problem solving
Spreadsheets and analysis
Reading business requirements
Working with business users
Explaining findings
Working with business users
Critical thinking
Working with business users
Active listening
Working with business users
Report checking
From the example resumes
Explaining results
Working with business users · from the example resumes
Inventory reconciliation
From the example resumes
Report specifications
Reports and dashboards · from the example resumes
Wrote Transact-SQL queries for a weekly dispatch report, checked totals against shipment records and explained exceptions to operations leads.
Queries and databases · writing example
Compared Oracle PL/SQL query results with an Oracle Database extract and resolved duplicate records before the finance report refreshed.
Queries and databases · writing example
Write SQL queries for a weekly shipping dashboard in Microsoft Power BI used by 8 dispatch supervisors to review late deliveries.
Queries and databases · from the entry level example · use your own numbers
Write Transact-SQL queries in Microsoft SQL Server for weekly fulfillment reviews across 13 delivery routes.
Queries and databases · from the career change example · use your own numbers
Compare Oracle Database inventory extracts with dispatch totals and investigate differences before the weekly review.
Queries and databases · from the career change example
Use Oracle PL/SQL and Oracle Database to investigate mismatched totals and update technical design notes after corrections.
Queries and databases · from the experienced example
Wrote SQL queries to reconcile account activity and explained account exceptions to the finance team.
Queries and databases · from the experienced example
Agreed monthly measures and refresh dates with department leads, then documented the report specifications before development.
Reports and dashboards · writing example
Show all 18 work examplesShow fewer
Built a dashboard for one claims team and documented the steps for updating its source workbook.
Reports and dashboards · transferable, from the entry level example
Built Tableau dashboards for operations leads, replacing 6 separate workbooks with a shared view of shipment exceptions.
Reports and dashboards · from the career change example · use your own numbers
Maintain 27 monthly executive reports in SAP Crystal Reports and Microsoft Power BI, including refresh checks and dashboard support.
Reports and dashboards · from the experienced example · use your own numbers
Document report specifications with 11 department leads, recording agreed measures and delivery schedules.
Reports and dashboards · from the experienced example · use your own numbers
Added a check for duplicate shipment records, reducing the weekly preparation routine by 2 hours.
Checking results · from the entry level example · use your own numbers
Prepared the weekly claims report in Microsoft Excel and checked totals with the team lead.
Spreadsheets and analysis · transferable, from the entry level example
Maintained Microsoft Excel inventory reports for store managers and flagged items needing a stock recount.
Spreadsheets and analysis · transferable, from the career change example
Prepared branch performance summaries in Microsoft Excel for monthly management reviews.
Spreadsheets and analysis · from the experienced example
Explain changes in shipment totals to operations leads before the weekly planning meeting.
From the entry level example
Reorganized the weekly reconciliation workbook so managers could review discrepancies by store and product.
Transferable, from the career change example
Economics graduate seeking a data analyst role, bringing a reporting internship and experience checking weekly claims totals in Microsoft Excel. Built a team dashboard and explained changes to its users.
Starting an analyst career · writing example
Nearly five years as an analyst after an inventory coordination role. Writes SQL Server queries and builds Tableau dashboards for operations leads, connecting stock questions with answers managers can use.
Moving from operations · writing example
Data analyst with 12 years across analyst and business intelligence roles. Maintains executive reports in SAP Crystal Reports and Microsoft Power BI, documents specifications with department leads and resolves dashboard support requests.
Experienced in business intelligence · writing example · use your own numbers
Data analyst with just over a year of experience writing SQL queries and maintaining a weekly shipping dashboard in Microsoft Power BI. Economics graduate with a reporting internship in health insurance and a careful approach to checking totals before a refresh.
From the entry level example
Nearly five years as an analyst turning distribution questions into SQL Server queries and Tableau dashboards. Brings four and a half years in inventory coordination, with experience reconciling inventory totals and explaining stock exceptions to managers.
From the career change example
Data analyst with twelve years in analyst and business intelligence roles. Maintains a library of monthly executive reports in SAP Crystal Reports and Microsoft Power BI, supports dashboard users and documents requirements with department leads.
From the experienced example
Google Data Analytics Professional Certificate, Google, [year]
How to list it · from the example resumes
CompTIA Data+, CompTIA, [year]
How to list it · from the example resumes
Microsoft Certified: Power BI Data Analyst Associate, Microsoft, [year]
How to list it · from the example resumes
Skills come from this guide and the example resumes.
Where they go in your resume: Work historySkillsSummaryCertifications
Find skills that match your experience in Data analyst resume skills
Add the tools you can discuss confidently, then show where you used them in work history.
Build My ResumeEducation and completed courses
What a data analyst’s workday is like
O*NET’s occupational experts rated how often or how much each aspect was part of business intelligence analysts’ work. O*NET dated the ratings August 2024. Each average uses the scale shown with it.
Tip: Bring an example of resolving a calculation error to an interview, and ask who approves a correction before the next refresh.
4.41 / 5 average rating for business intelligence analysts: importance of being exact or accurate. Scale: “Not important at all” to “Extremely important.”
Ask: How are totals checked before they reach a department lead?
4.23 / 5 average rating for business intelligence analysts: freedom to make decisions. Scale: “No freedom” to “A lot of freedom.”
Ask: Which dashboard changes can an analyst make without approval?
4.21 / 5 average rating for business intelligence analysts: face-to-face discussions. Scale: “Never” to “Every day.”
Ask: How do analysts review requirements with the people who use them?
3.73 / 5 average rating for business intelligence analysts: time pressure. Scale: “Never” to “Every day.”
Ask: How does the team handle a late source extract before a delivery deadline?
Describe an accuracy check in work history that you can explain at an interview.
Build My ResumeWhere a data analyst career can lead
The Occupational Outlook Handbook lists market research analysts, operations research analysts and financial analysts as occupations similar to data scientists. Explore the related resume guides for data scientist, senior data scientist and quantitative analyst when considering a different title.
Tip: For each role you consider, collect a report or query from your own work that matches its job description.
Compare related technology jobs
| Job | Median pay | Typical entry education |
|---|---|---|
| Data scientists | $120,230 | Bachelor's degree |
| Survey researchers | $69,460 | Master's degree |
| Market research analysts | $78,760 | Bachelor's degree |
| Operations research analysts | $88,940 | Bachelor's degree |
| Financial analysts | $103,570 | Bachelor's degree |
| Mathematicians and statisticians | $105,720 | Master's degree |
Pay gaps don’t show a typical career move, and each job has its own requirements. See pay for data scientists by state.
Source: U.S. Bureau of Labor Statistics, median annual pay, May 2025 · checked Oct 23, 2026
Choose a related role's requirements to guide a separate resume version.
Build My ResumeData analyst salary and job outlook
Government estimates for May 2025. Pay depends on your state, work setting and experience. These figures are for data scientists.
Tip: Use the range of data scientists’ pay to prepare questions about a role’s pay range, then build around its report and dashboard requirements.
Pay for data scientists by state
Median annual wage, May 2025. Highest of the 48 states and DC with published pay: Washington, $163,350. Tap a state to see its numbers.
- Under $92,000
- $92,000–$99,999
- $100,000–$105,999
- $106,000–$125,999
- $126,000 or more
- No data
Selected state
California
- Median
- $141,590
- Average
- $156,000
- Lowest to highest 10%
- $77,480 – $224,920
- Jobs in the state
- 39,310
National median: $120,230. State figures are annual; see the national pay range for hourly wages.
See all 49 areas
| State | Median | Average | Lowest 10% | Highest 10% | Jobs |
|---|---|---|---|---|---|
| Alabama | $103,120 | $105,180 | $59,130 | $161,590 | 1,740 |
| Alaska | $84,110 | $89,810 | $51,550 | $138,400 | 230 |
| Arizona | $107,240 | $111,950 | $65,200 | $161,730 | 4,560 |
| Arkansas | $109,390 | $116,320 | $67,090 | $169,110 | 530 |
| California | $141,590 | $156,000 | $77,480 | $224,920 | 39,310 |
| Colorado | $117,400 | $126,800 | $74,470 | $189,630 | 6,280 |
| Connecticut | $126,340 | $129,850 | $75,700 | $204,680 | 1,760 |
| District of Columbia | $126,490 | $142,580 | $89,750 | $209,730 | 2,680 |
| Florida | $115,820 | $119,150 | $63,080 | $174,140 | 10,240 |
| Georgia | $104,340 | $115,940 | $67,750 | $170,010 | 9,260 |
| Hawaii | $102,130 | $118,940 | $77,270 | $172,870 | 300 |
| Idaho | $89,380 | $110,220 | $63,980 | $169,010 | 1,350 |
| Illinois | $106,560 | $117,870 | $68,810 | $168,880 | 10,520 |
| Indiana | $91,470 | $98,340 | $58,750 | $141,250 | 3,580 |
| Iowa | $95,830 | $98,100 | $56,070 | $146,700 | 2,300 |
| Kansas | $98,130 | $105,080 | $60,520 | $154,990 | 490 |
| Kentucky | $91,760 | $100,840 | $61,990 | $156,480 | 1,540 |
| Louisiana | $78,760 | $88,480 | $53,050 | $128,210 | 1,300 |
| Maine | $90,880 | $97,500 | $60,280 | $138,530 | 1,210 |
| Maryland | $136,370 | $144,080 | $77,930 | $213,270 | 3,340 |
| Massachusetts | $131,750 | $136,460 | $81,030 | $206,220 | 9,420 |
| Michigan | $100,590 | $105,890 | $60,830 | $162,670 | 7,360 |
| Minnesota | $128,800 | $126,290 | $65,730 | $179,640 | 4,020 |
| Mississippi | $69,490 | $79,290 | $43,940 | $125,990 | 440 |
| Missouri | $97,090 | $100,880 | $58,960 | $151,380 | 4,730 |
| Montana | $100,490 | $108,170 | $67,120 | $167,150 | 220 |
| Nebraska | $98,230 | $98,980 | $66,230 | $133,140 | 1,980 |
| Nevada | $98,540 | $108,340 | $57,150 | $164,110 | 1,680 |
| New Hampshire | $100,620 | $109,880 | $73,480 | $155,020 | 1,100 |
| New Jersey | $135,280 | $138,590 | $80,720 | $203,950 | 6,430 |
| New Mexico | $95,850 | $94,160 | $49,990 | $133,660 | 560 |
| New York | $130,460 | $137,690 | $73,330 | $214,080 | 23,970 |
| North Carolina | $119,090 | $121,270 | $65,970 | $172,830 | 11,430 |
| North Dakota | $81,900 | $87,570 | $59,030 | $126,710 | 210 |
| Ohio | $102,630 | $107,160 | $61,710 | $160,650 | 6,100 |
| Oklahoma | $86,310 | $94,950 | $58,690 | $145,580 | 1,900 |
| Oregon | $125,990 | $131,300 | $78,110 | $206,550 | 2,140 |
| Pennsylvania | $106,850 | $110,810 | $63,340 | $162,290 | 13,810 |
| Rhode Island | $102,440 | $111,260 | $75,310 | $158,820 | 1,160 |
| South Carolina | $91,990 | $102,830 | $61,600 | $156,000 | 3,750 |
| South Dakota | $96,150 | $102,450 | $67,510 | $145,510 | 220 |
| Tennessee | $100,330 | $105,200 | $60,200 | $156,160 | 2,790 |
| Texas | $122,090 | $119,710 | $64,540 | $170,780 | 25,860 |
| Utah | $108,090 | $114,880 | $60,680 | $167,890 | 4,360 |
| Vermont | $127,070 | $123,640 | $76,570 | $160,430 | 200 |
| Virginia | $126,430 | $134,590 | $76,420 | $207,890 | 8,920 |
| Washington | $163,350 | $158,040 | $79,930 | $220,040 | 9,600 |
| West Virginia | $85,090 | $90,730 | $57,500 | $125,100 | 390 |
| Wisconsin | $106,680 | $116,600 | $76,300 | $168,810 | 4,370 |
Source: U.S. Bureau of Labor Statistics, Occupational Employment and Wage Statistics, May 2025 · checked Oct 23, 2026 · lowest and highest 10% are the 10th and 90th percentile wages
National pay range
Annual wages for all U.S. data scientists
| Percentile | Annual | Hourly |
|---|---|---|
| 10th | $67,240 | $32.33 |
| 25th | $85,660 | $41.18 |
| Median | $120,230 | $57.80 |
| 75th | $158,880 | $76.39 |
| 90th | $199,130 | $95.74 |
Source: U.S. Bureau of Labor Statistics, Occupational Employment and Wage Statistics, May 2025 · checked Oct 23, 2026
More pay data: state rankings and pay by work setting
State rankings
Top five among states and DC with published figures
Source: U.S. Bureau of Labor Statistics, Occupational Employment and Wage Statistics, May 2025 · checked Oct 23, 2026 · ranked by annual mean wage or jobs per 1,000 jobs
Median pay by work setting
Annual median, May 2025
- Publishing, broadcasting, and content providers$142,240
- Computer systems design and related services$132,380
- Credit intermediation and related activities$129,490
- Management of companies and enterprises$128,050
- Insurance carriers and related activities$108,650
Source: Occupational Outlook Handbook, May 2025 · checked Oct 23, 2026
Projected job growth, 2025–35
Change in employment over ten years
- Data scientists35%
- Mathematical science occupations25%
- All occupations3%
That's 95,400 more jobs over ten years and about 24,800 openings a year, counting people who retire or change jobs.
Source: U.S. Bureau of Labor Statistics, Employment Projections 2025–35 · checked Oct 23, 2026
Where data scientists work
Share of the 275,600 jobs in 2025 (largest settings)
- Publishing, broadcasting, and content providers12%
- Computer systems design and related services10%
- Insurance carriers and related activities10%
- Management of companies and enterprises10%
- Credit intermediation and related activities6%
The rest work in other settings.
Source: Occupational Outlook Handbook · checked Oct 23, 2026
Use the pay context to prepare compensation questions; build your resume around the requested reporting work.
Build My ResumeAbout this guide
Updated November 14, 2026.
Sources
Loading industries…
Build your data analyst resume
Start with a report you know well. Build a resume that shows the question it answered, the checks you made and how its readers used the result.