Data scientist resume examples, templates and tips
Turn projects, research and work experience into a data scientist resume. Use the examples to explain your methods, show how you tested results and make your contribution clear.
- Explain model results
- Showcase relevant projects
- Move from research to industry
- Write a focused summary

What data scientist hiring managers look for
- Defining a business question that data can answer.
- Cleaning and analyzing data with statistical software.
- Testing and validating predictive models.
- Comparing models with appropriate performance metrics.
- Writing functions or applications for analysis.
- Creating visualizations that convey findings.
How to write a data scientist resume
A model score does not explain why the work mattered. Show the data you used, how you tested the model and what decisions it helped people make. Separate internships, research and industry jobs. This guide starts with six questions to answer first, then walks through each part of your resume with tips and links to the examples, templates and data on this page.
Six questions to answer first
- How do I match a data science job description?
Step 1 connects the requested methods to results from your work.
- How do I apply without a data scientist title?
Step 3 shows how internships, projects and research support your application.
- How do I describe data science projects and results?
Step 5 turns a model into a problem, method and result.
- Which technical tools belong on a data scientist resume?
Step 7 ties technical skills to work you can describe.
- What should a data scientist summary say?
Step 8 connects your background to the analysis the role needs.
- Where do data science courses and certificates go?
Step 9 separates completed credentials from ongoing study.
What a data scientist does
Data scientists turn raw data into useful information. They identify questions, clean and analyze data, compare models, present findings and recommend actions to stakeholders.
The national median annual wage for data scientists was $120,230 in May 2025. BLS projects employment growth of 35% from 2025 to 2035.
See also: Data scientist salary and job outlookProjected job growthWhere data scientists work
Tip: Describe both the analysis and the decision it informed; a model name alone leaves your contribution unclear.
Write your data scientist resume in nine steps
Do the first two before you open the builder. The other seven follow the builder’s order.
Step 1 of 9
Before you open the builder
Job description: find the problem behind the tool list
How do I match a data science job description?
Separate the business problem, modeling methods and tools the role names. For each match, choose an accomplishment that shows how you used it.
Tip: Underline the business question, data sources and evaluation criteria before choosing accomplishments.
Make these easy to find
- Defining a business question that data can answer.
- Cleaning and analyzing data with statistical software.
- Testing and validating predictive models.
- Comparing models with appropriate performance metrics.
- Writing functions or applications for analysis.
- Creating visualizations that convey findings.
- Presenting results and recommendations to stakeholders.
- Recognizing factors that could change an analysis.
Adapted from O*NET OnLine, Data Scientists (15-2051.00), CC BY 4.0.
Match each requirement in the job description
Here’s the step where you’ll show each one:
- Business question step 8
- Model evaluation step 5
- Programming and data step 7
- Statistical methods step 6
- Stakeholder communication step 5
- Optional credentials step 9
Tip: If the role asks for forecasting, show how you evaluated a forecast rather than adding forecasting to a tool list.
See also: Skills and examplesResume examples
Choose an analysis that answers a problem in the job description, then build your work history around it.
Build My Resume
Before you open the builder
Examples: notice how each result is supported
Tip: A strong project entry lets someone ask useful follow-up questions about the data and your choices.
Look at how each applicant supports a result: a baseline for a forecast, a controlled experiment in insurance, or reproducible research. Use that level of context in your own descriptions.
Build your resume using the closest example, with your own data, test and contribution.
Build My ResumeIn the builder: experience level
How much experience do you have?
How do I apply without a data scientist title?
Keep your actual titles and show relevant work through internships, degree projects or research. Label the setting so readers can distinguish study from industry experience.
Tip: Choose section order by the strength of the work you can show: an internship, a deployed model or a research project.
Start from Build My Resume and it’s the builder’s first question. The examples below show three starting points: a recent statistics graduate with an internship, an experienced data scientist in insurance and a researcher moving into industry.
Choose an order that fits
- Recent graduate:
- Summary, Education, Internship, Projects, Skills.
- Experienced applicant:
- Summary, Work history, Skills, Education, Credentials.
- Research career changer:
- Summary, Research experience, Selected projects, Skills, Education.
The builder starts with a standard order, and you can move sections into the one you choose.
Keep a project when it shows a relevant method your work history does not. Cut older coursework that repeats stronger evidence.
See also: Entry-level data scientist resume exampleExperienced data scientist resume exampleData scientist resume example for a research career changer
Build from work you can explain clearly, whether it came from an internship, research or an industry role.
Build My ResumeIn the builder
Template: keep technical accomplishments easy to scan
Tip: Check that project names, evaluation metrics and dates remain easy to find in the design you choose.
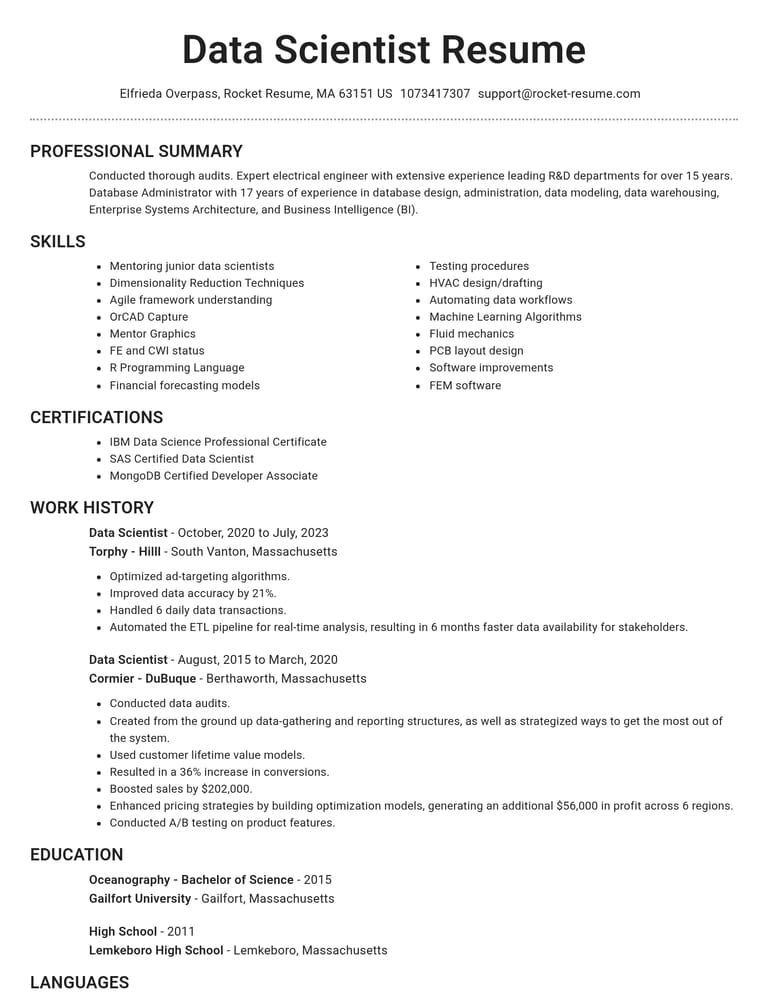
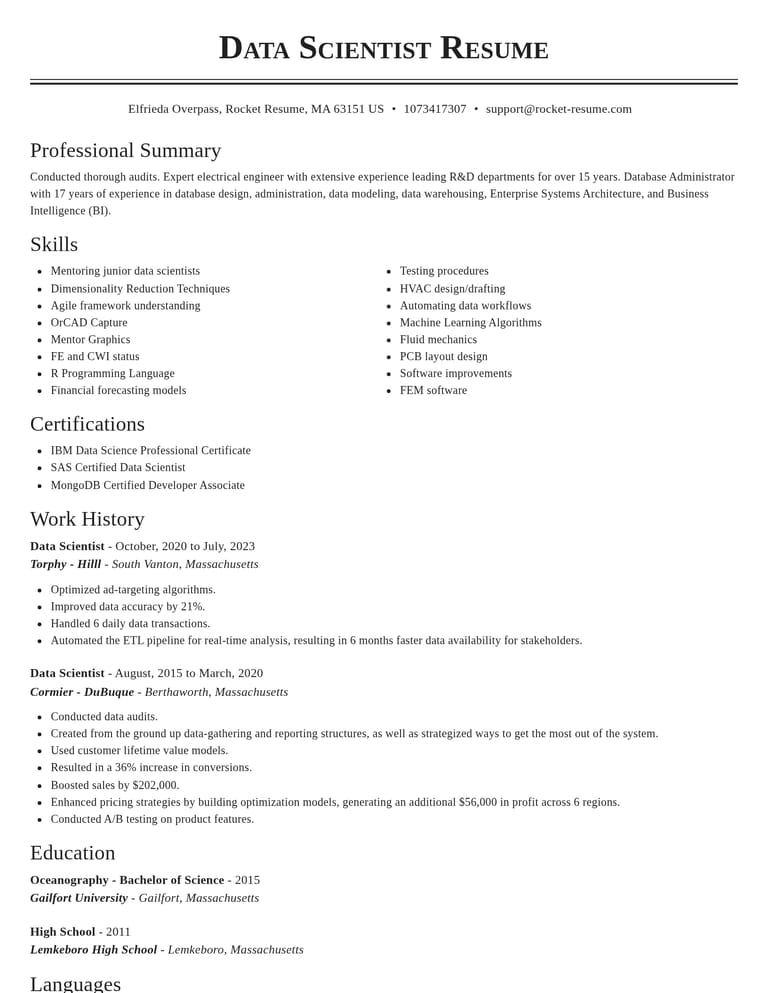
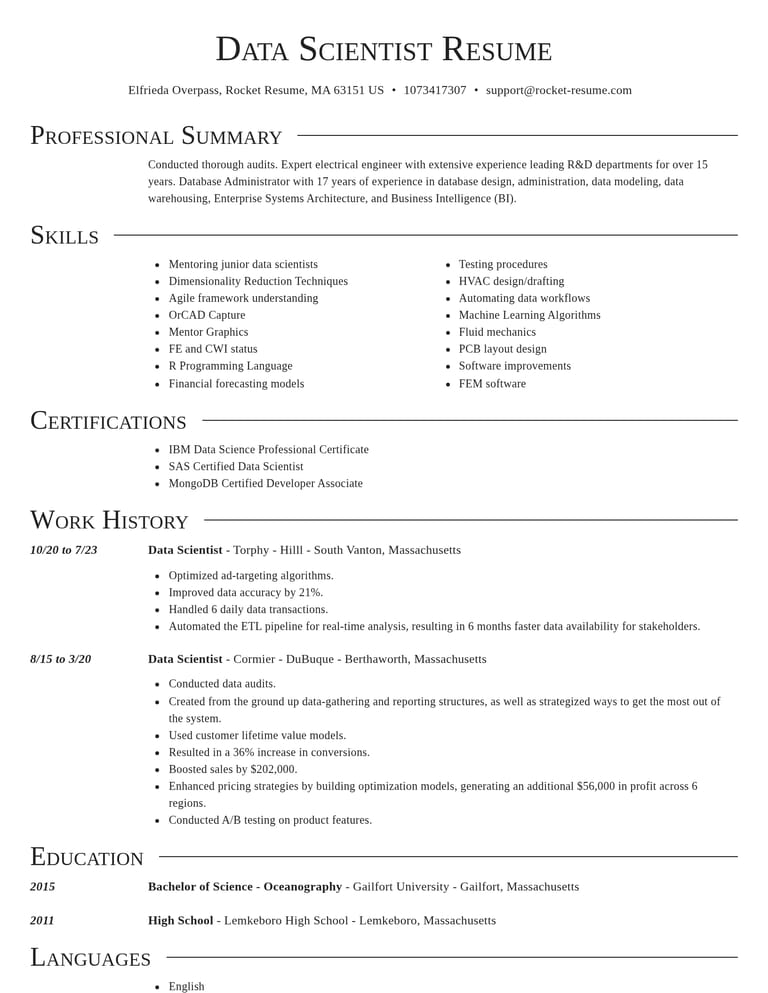
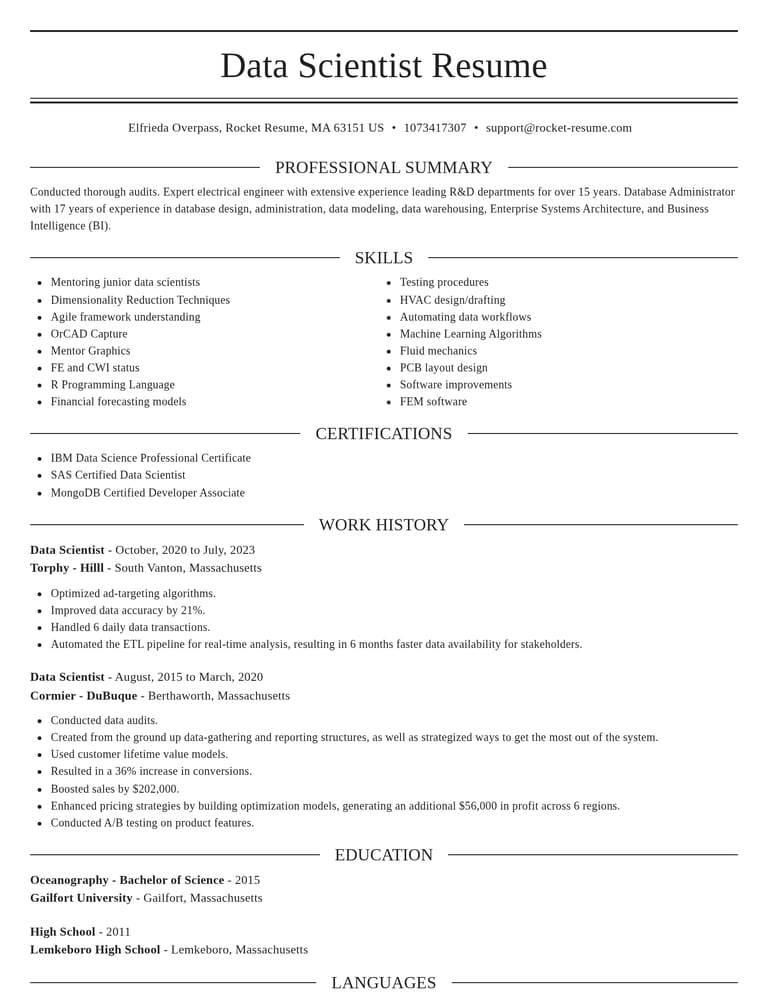
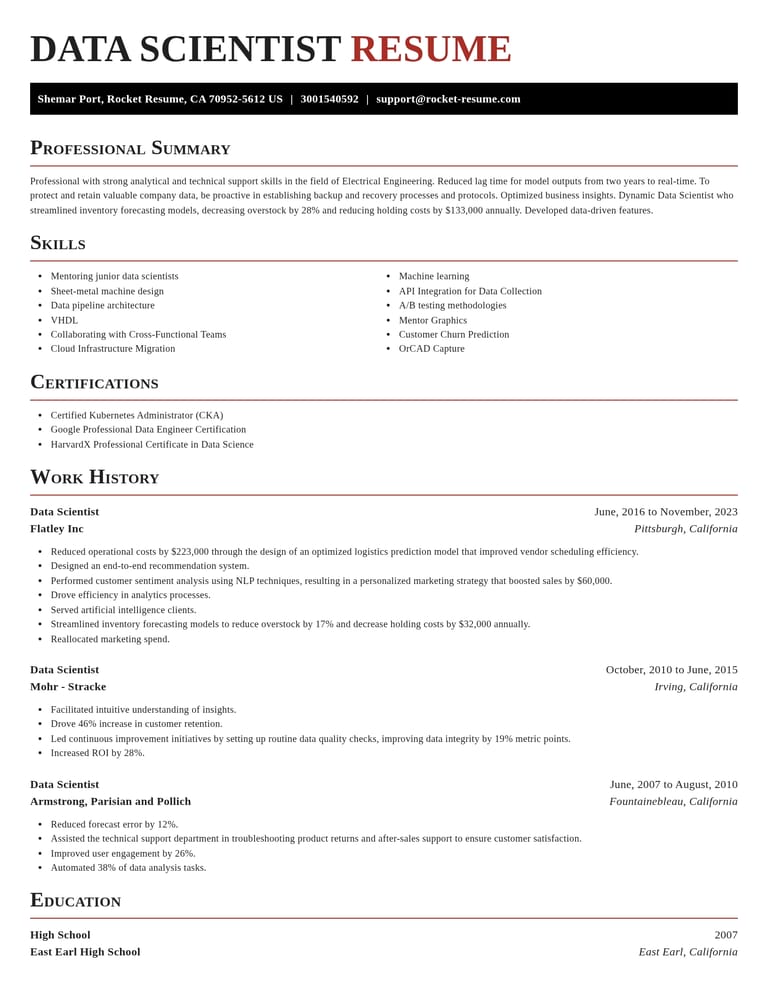
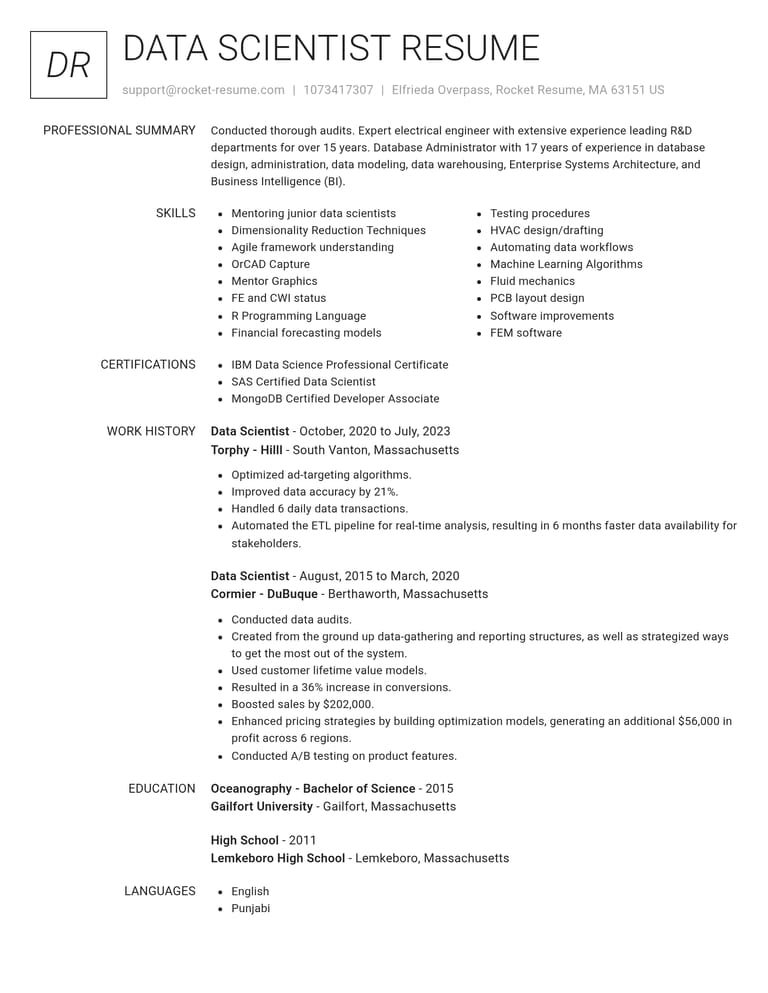
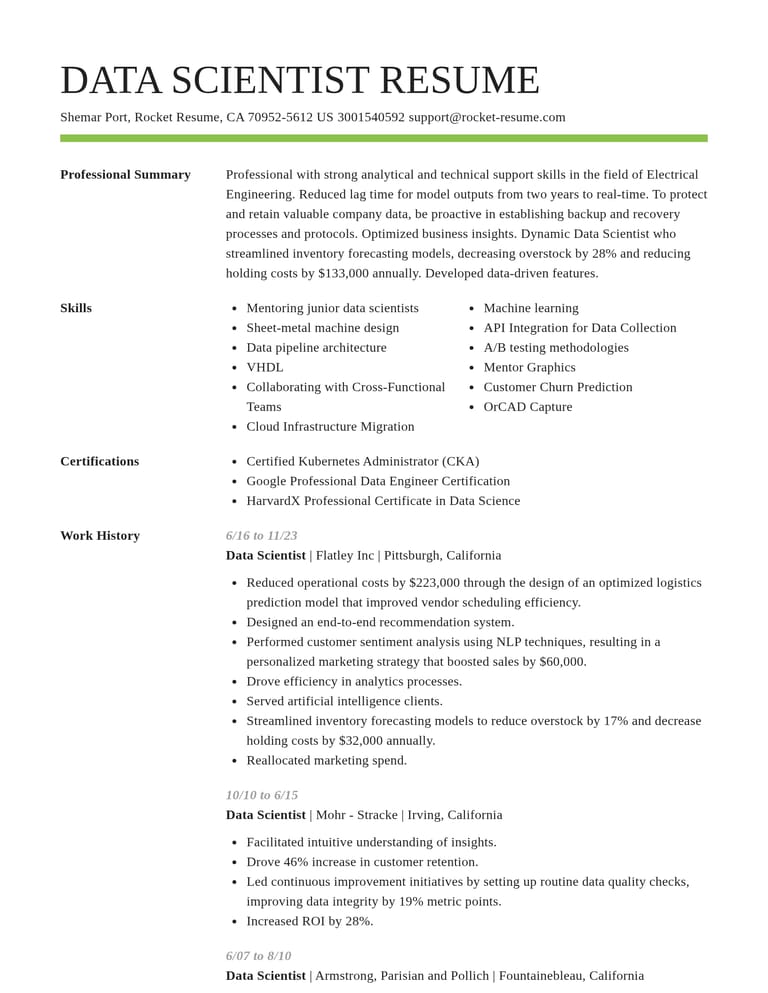
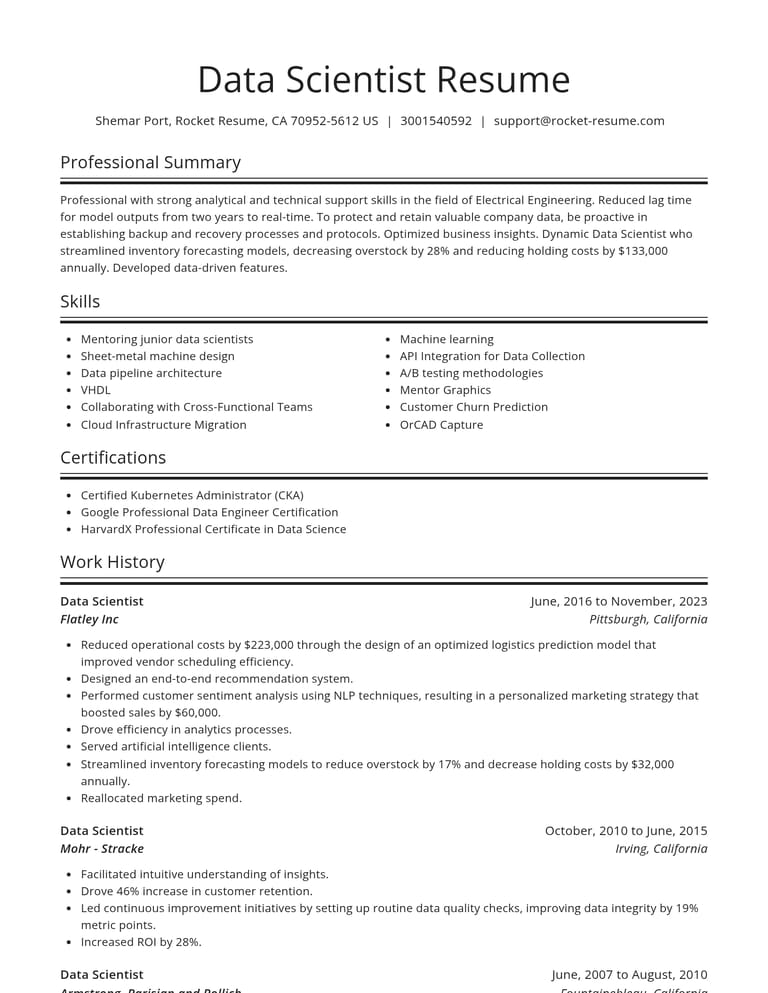
Prefer a layout that gives model results room for context. Keep skill groups readable and use consistent spacing so a hiring reader can move from your summary to the work that supports it.
Choose a template with room to explain a model result, then add your contact details and work history.
Build My ResumeIn the builder
Work history: connect the model to a measured outcome
How do I describe data science projects and results?
Describe the question, data, method and evaluation, then identify your contribution. Distinguish an offline test result from an outcome measured after deployment.
Tip: Name the metric, baseline and evaluation setting; claim business impact when you measured it.
Describe the problem, data, method and evaluation, then state what you owned. Label degree projects clearly and separate your contribution from the team’s result.
If the job description asks for Show this on your resume Model evaluation Baseline, test design and result from a model you evaluated. Stakeholder communication A recommendation and how you described its limitations. Before
“Built a prediction model using Python.”
After
“Built a demand forecast in Python using 24 months of order data; reduced holdout mean absolute error from 18 to 13 units versus a seasonal baseline.”
When an outcome cannot be quantified, describe the validation, recommendation or handoff you completed without inventing a metric.
For ideas on showing your results, explore Data scientist accomplishments
See also: Resume examplesWork examples (24)
Build your work history around results with a baseline and test setting, so readers can judge what your analysis showed.
Build My ResumeIn the builder
Education: show the methods behind the degree
Tip: Add coursework or a thesis topic when it helps show your preparation in a method the job description requests.
List the degree, school and completion status, then select statistical or computing study. BLS describes the fields and degree levels this way. Data scientists typically need at least a bachelor’s degree, but some jobs require a master’s or doctoral degree. Common fields of degree include mathematics, statistics, computer science, business, and engineering.
If the job description asks for Show this on your resume Statistical methods Methods applied in a degree, internship or research project. Describe a thesis as research; do not relabel it as employment in industry.
See also: Resume examplesOptional machine learning and analytics credentials
Build the education section around your degree and relevant study. Keep thesis work clearly labeled as research.
Build My ResumeIn the builder
Skills: pair methods with examples of use
Which technical tools belong on a data scientist resume?
Select languages, statistical methods and tools you have used for relevant tasks. Keep proficiency claims specific enough to defend in a technical interview.
Tip: Group languages, statistical methods and visualization skills so readers can find the relevant tools quickly.
Choose skill names that match your work. Support Python, SQL or statistical methods with a project; support communication with a presentation or recommendation.
If the job description asks for Show this on your resume Programming and data Languages and querying tools you used for analysis. Analysis and modeling
- Statistical analysis
- Data cleaning
- Model validation and comparison
Programming and visualization
- Python
- SQL
- R
A skill list helps a reader scan. A work example under a job shows what you did.
Skill
Model validation and comparison
Work example
Compared a classification model with a logistic baseline on a held-out dataset, improving precision from 0.61 to 0.74 at the same recall.
See also: Skills (22)Work examples (24)
Select relevant technical skills, then check that your resume shows where you used them.
Build My ResumeIn the builder
Summary: lead with models, methods and results
What should a data scientist summary say?
Name your background, methods and a concrete contribution. A graduate can use project results; an experienced applicant can use a measured outcome.
Tip: Replace broad claims about passion for data with a method, domain or contribution that distinguishes your background.
Choose accomplishments that match the target role instead of opening with a catalog of tools. Keep a research background recognizable, and avoid implying that a student project was a deployed commercial system.
If the job description asks for Show this on your resume Business question A decision your analysis helped address. Summary if you’re new to data science
“Statistics master’s graduate with a data science internship and projects in forecasting and classification. Uses Python, SQL and R to clean data, compare baselines and explain uncertainty.”
Summary if you’re experienced in industry
“Data scientist with five years in insurance analytics. Connects model validation and controlled experiments to operational decisions, including a tested improvement in renewal conversion.”
Summary if you’re moving from research
“Quantitative researcher transitioning to industry data science, with experience in statistical modeling, reproducible analysis and collaborative research. Translates complex findings into clear decisions and documented limitations.”
Shape your introduction with help from Data scientist summary examples
See also: Summaries (6)
Build your summary around the data problems you can solve, using evidence already in your work history and projects.
Build My ResumeIn the builder
Certifications: separate earned credentials from study
Where do data science courses and certificates go?
Use the education section for degrees and relevant coursework. Put earned machine learning or analytics credentials in the certifications section, and mark unfinished study as in progress.
Tip: Use the issuer’s full credential name and state its status accurately; keep course completion distinct from certification.
List earned machine learning and analytics credentials in a certifications section. Keep degree coursework under education and label ongoing courses clearly. Optional additional sections follow the summary.
Certified Analytics Professional (CAP), INFORMS, [year]
How to list it · copy the wording on your certificate
Professional Machine Learning Engineer, Google Cloud, [year]
How to list it · copy the wording on your certificate
AWS Certified Machine Learning Engineer – Associate, AWS, [year]
How to list it · copy the wording on your certificate
Databricks Certified Machine Learning Associate, Databricks, [year]
How to list it · copy the wording on your certificate
If the job description asks for Show this on your resume Optional credentials An earned optional credential, when relevant to the role. See also: Optional machine learning and analytics credentialsCertifications (6)
Build your certifications section with earned analytics or machine learning credentials, keeping course completion separate from professional certification.
Build My Resume
Data scientist resume mistakes to fix before you apply
How Rocket Resume helps
Four ways the builder helps with your data scientist resume:
- Job descriptions. Keep one resume in your account and adjust it to fit each one.
- Experience level. The builder asks how much experience you have first, then guides you from there.
- Your own numbers. Choose a suggestion, then edit it to add the numbers from your work.
- Saved suggestions. Save a skill, example, summary or certification on this page, and it waits for you in the builder.
What does a data scientist resume look like?
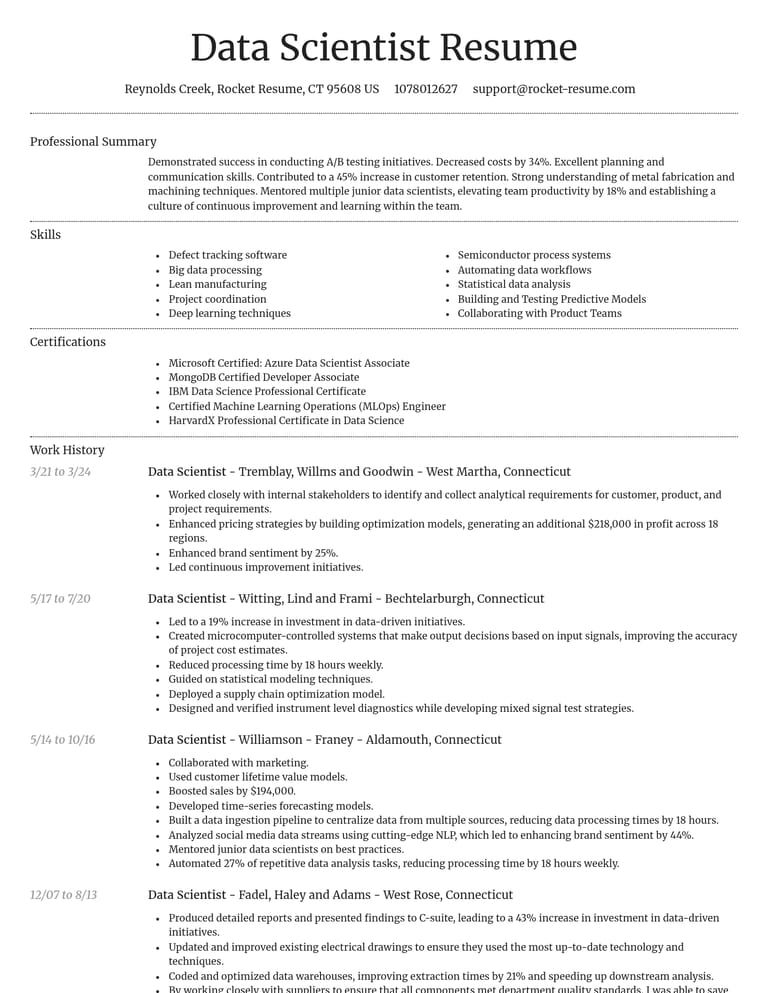
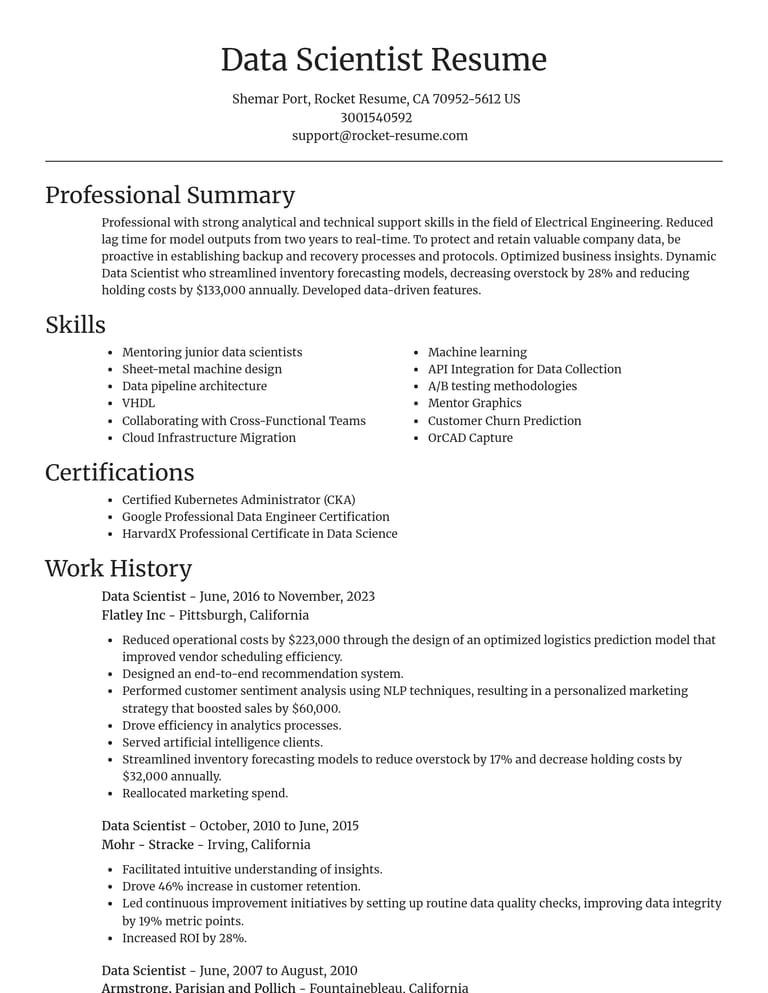
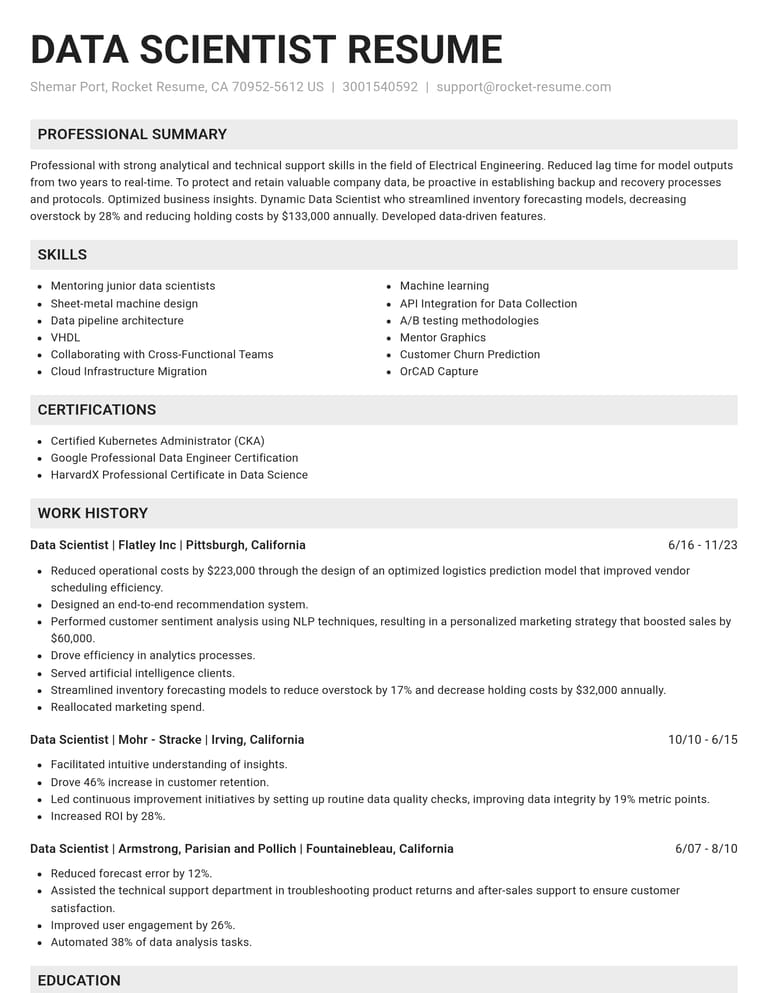
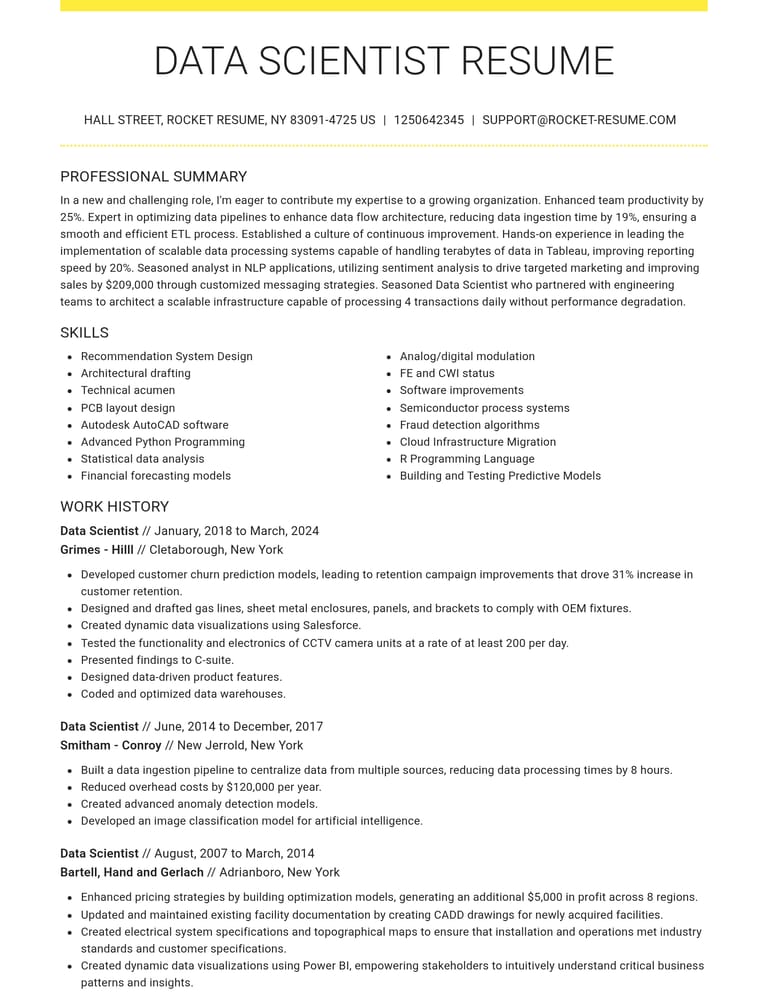
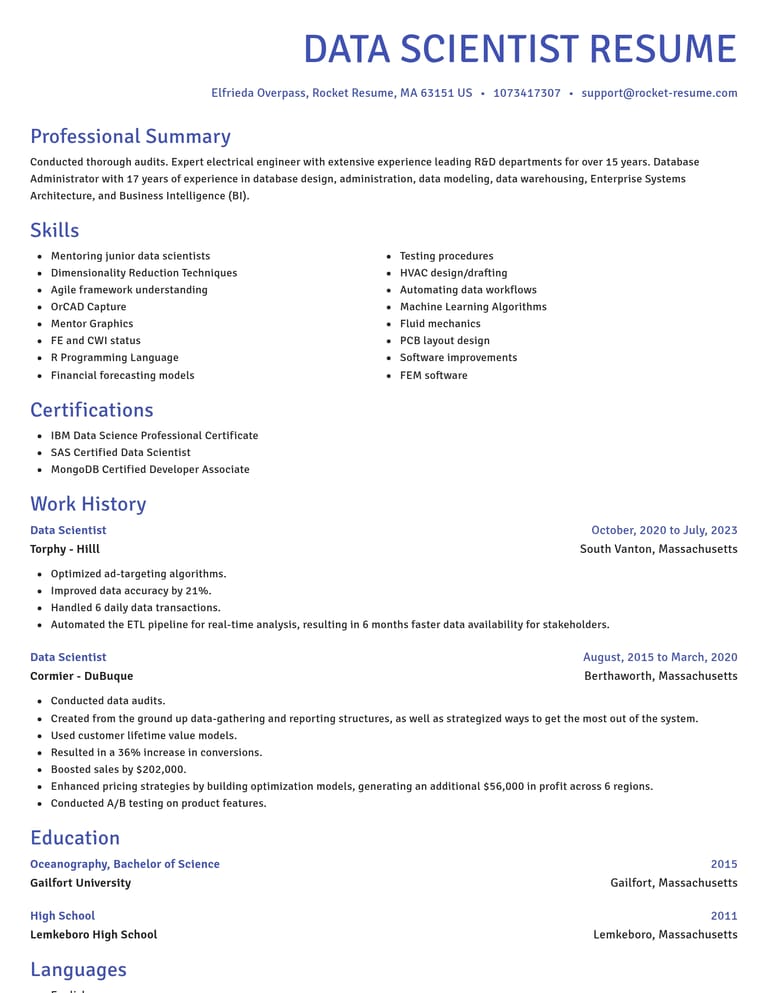
Compare a graduate, an experienced data scientist and a researcher moving into industry. Each resume is an illustrative composite.
Tip: Read the project context before borrowing its structure; the work you can support determines which results belong.
Entry-level data scientist resume example
Madison, WI · recent statistics master’s graduate · internship and two projects
Avery L.
Data science graduate
avery.l@example.com · (608) 555-0141 · Madison, WI
Summary
Statistics master’s graduate with an analytics internship and projects in demand forecasting and classification. Uses Python, SQL and R to test assumptions, compare baselines and communicate uncertainty.
Experience
Data science intern · Example Distribution Group
Jan 2026 – May 2026
- Joined 180,000 order records in SQL and documented missing delivery dates before analysis.
- Built a Python report that reduced weekly reconciliation time from 4 hours to 90 minutes during the internship.
- Presented error checks and remaining data gaps to the operations team.
Demand forecasting project · Example Statistics University
Sep 2025 – Dec 2025
- Evaluated forecasts on a final 12-week holdout, reducing mean absolute error from 21 to 16 units versus a seasonal baseline.
- Used time-ordered validation and documented how promotions affected forecast reliability.
Classification project · Example Statistics University
Feb 2025 – May 2025
- Compared logistic regression with a tree-based classifier on 8,000 synthetic records using stratified validation.
- Reported precision and recall across thresholds and documented the limits of using synthetic data.
Education and credentials
Master of Science in Statistics · Example Statistics University, 2026
Intro to Machine Learning (completed course), Kaggle, 2025
Skills
- Python
- SQL
- R
- Statistical analysis
- Model validation
- Data visualization
Why this example works
- Project evaluationThe forecast result identifies a holdout and comparison rather than presenting an unexplained score.
- Internship contributionThe time saving is tied to an operational report the applicant built.
- Clear settingDegree projects and internship duties remain distinct.
Experienced data scientist resume example
Columbus, OH · five years in insurance analytics
Morgan P.
Data scientist
morgan.p@example.com · (614) 555-0152 · Columbus, OH
Summary
Data scientist with five years in insurance analytics, combining predictive modeling, experiment design and stakeholder communication. Evaluates model performance separately from measured operational results.
Experience
Data scientist · Example Mutual Insurance
Jul 2023 – Present
- Built a claims triage model using 240,000 historical claims; increased holdout precision from 0.58 to 0.71 at fixed recall.
- Designed an 8-week randomized renewal experiment across 30,000 eligible accounts; measured a 1.4 percentage-point increase in conversion with a 95% confidence interval of 0.6 to 2.2 percentage points.
- Partnered with operations to introduce a triage workflow; measured median review time falling from 19 to 15 minutes during a monitored rollout.
- Created SQL checks for missing fields and monitored model drift, escalating changes to the review team.
Data scientist · Example Risk Services
Jul 2021 – Jun 2023
- Built R analyses of policy retention and presented segment-level uncertainty to account teams.
- Automated a monthly Python validation report, reducing preparation time from 2 days to 4 hours.
- Documented data definitions and reviewed analysis code with engineering colleagues.
Education and credentials
Bachelor of Science in Applied Mathematics · Example Applied Sciences College, 2021
Certified Analytics Professional (CAP), INFORMS, 2026
Skills
- Python
- SQL
- R
- Experiment design
- Predictive modeling
- Model monitoring
- Stakeholder communication
Why this example works
- Different kinds of impactModel precision, experiment results and review time are described with their own evaluation settings.
- Domain detailClaims triage and renewal decisions explain the insurance context.
- Operational responsibilityMonitoring and collaboration show what happened after model development.
Data scientist resume example for a research career changer
Raleigh, NC · PhD and postdoctoral research · moving into industry
Rowan S.
Quantitative researcher
rowan.s@example.com · (919) 555-0163 · Raleigh, NC
Summary
Quantitative researcher transitioning to industry data science after doctoral and postdoctoral work. Builds reproducible statistical analyses, evaluates models and explains findings to collaborators with different technical backgrounds.
Experience
Postdoctoral researcher · Example Environmental Research Institute
Sep 2023 – Present
- Integrated 1.2 million sensor observations using Python and SQL, with checks for timestamp errors and missing measurements.
- Reduced held-out prediction error by 17% versus the prior statistical baseline using site-separated validation.
- Prepared reproducible analyses for 3 peer-reviewed publications and explained modeling assumptions to field researchers.
- Coordinated an analysis handoff with 4 collaborators, documenting inputs, tests and known limitations.
Doctoral researcher · Example Quantitative Research University
Sep 2019 – Aug 2023
- Developed R models to estimate population trends and used bootstrap intervals to communicate uncertainty.
- Reorganized a repeated analysis into tested functions, reducing a full rerun from 6 hours to 2 hours.
- Presented findings at research meetings and documented data collection limitations.
Education and credentials
PhD in Quantitative Ecology · Example Quantitative Research University, 2023
Writing Functions in R (completed course), DataCamp, 2024
Skills
- Python
- R
- SQL
- Statistical modeling
- Reproducible analysis
- Model validation
- Research communication
Why this example works
- Accurate titlesResearch appointments keep their names while the summary explains the industry goal.
- Transferable methodsValidation, reproducibility and data checks translate research into relevant technical evidence.
- Selected publication evidencePublications show completed analytical work without taking over the resume.
Choose the example closest to your background, then build a resume using its structure and your own analytical work.
Build My ResumeLoading resume templates…
Data scientist resume questions
What belongs on a data science resume?
What skills are needed for a data scientist?
Does AI mean fewer opportunities for data scientists?
Which keywords help a data scientist resume match a role?
Should a researcher use a CV or a resume for US applications?
Is a graduate degree necessary for data science work?
How should I present a GitHub profile or portfolio?
Gather your project notes and research records, then build a resume that makes your methods and contribution easy to follow.
Build My ResumeData scientist resume skills and examples
Browse skills, work examples, summaries and certifications. Save the ones that fit, then make each one true to your own work.
Tip: Save recommendations that match methods you have used, including how you explained the findings to others.
Statistical analysis
Analysis and modeling
Data cleaning
Analysis and modeling
Model validation and comparison
Analysis and modeling
Feature selection
Analysis and modeling
Sampling methods
Analysis and modeling
Python
Programming and visualization
SQL
Programming and visualization
R
Programming and visualization
Show all 22 skillsShow fewer
Analytical programming
Programming and visualization
Data visualization
Programming and visualization
Tableau
Programming and visualization
Stakeholder communication
Communication and judgment
Critical thinking
Communication and judgment
Active listening
Communication and judgment
Written presentation of findings
Communication and judgment
Collaborative problem solving
Communication and judgment
Experiment design
From the example resumes
Predictive modeling
Analysis and modeling · from the example resumes
Model monitoring
Analysis and modeling · from the example resumes
Statistical modeling
Analysis and modeling · from the example resumes
Reproducible analysis
Analysis and modeling · from the example resumes
Research communication
Communication and judgment · from the example resumes
Compared a classification model with a logistic baseline on a held-out dataset, improving precision from 0.61 to 0.74 at the same recall.
Analysis and modeling · writing example · use your own numbers
Used time-ordered validation and documented how promotions affected forecast reliability.
Analysis and modeling · transferable, from the entry level example
Compared logistic regression with a tree-based classifier on 8,000 synthetic records using stratified validation.
Analysis and modeling · transferable, from the entry level example · use your own numbers
Built a claims triage model using 240,000 historical claims; increased holdout precision from 0.58 to 0.71 at fixed recall.
Analysis and modeling · from the experienced example · use your own numbers
Documented data definitions and reviewed analysis code with engineering colleagues.
Analysis and modeling · from the experienced example
Reduced held-out prediction error by 17% versus the prior statistical baseline using site-separated validation.
Analysis and modeling · transferable, from the research example · use your own numbers
Prepared reproducible analyses for 3 peer-reviewed publications and explained modeling assumptions to field researchers.
Analysis and modeling · transferable, from the research example · use your own numbers
Coordinated an analysis handoff with 4 collaborators, documenting inputs, tests and known limitations.
Analysis and modeling · transferable, from the research example · use your own numbers
Show all 24 work examplesShow fewer
Reorganized a repeated analysis into tested functions, reducing a full rerun from 6 hours to 2 hours.
Analysis and modeling · transferable, from the research example · use your own numbers
Joined 180,000 order records in SQL and documented missing delivery dates before analysis.
Programming and visualization · from the entry level example · use your own numbers
Built a Python report that reduced weekly reconciliation time from 4 hours to 90 minutes during the internship.
Programming and visualization · from the entry level example · use your own numbers
Created SQL checks for missing fields and monitored model drift, escalating changes to the review team.
Programming and visualization · from the experienced example
Automated a monthly Python validation report, reducing preparation time from 2 days to 4 hours.
Programming and visualization · from the experienced example · use your own numbers
Integrated 1.2 million sensor observations using Python and SQL, with checks for timestamp errors and missing measurements.
Programming and visualization · transferable, from the research example · use your own numbers
Presented forecast limitations to operations colleagues and agreed on a review process for unusual demand.
Communication and judgment · writing example
Presented error checks and remaining data gaps to the operations team.
Communication and judgment · from the entry level example
Built R analyses of policy retention and presented segment-level uncertainty to account teams.
Communication and judgment · from the experienced example
Developed R models to estimate population trends and used bootstrap intervals to communicate uncertainty.
Communication and judgment · transferable, from the research example
Presented findings at research meetings and documented data collection limitations.
Communication and judgment · transferable, from the research example
Used bootstrap confidence intervals to explain uncertainty in an experiment before recommending a wider test.
Writing example
Evaluated forecasts on a final 12-week holdout, reducing mean absolute error from 21 to 16 units versus a seasonal baseline.
Transferable, from the entry level example · use your own numbers
Reported precision and recall across thresholds and documented the limits of using synthetic data.
Transferable, from the entry level example
Designed an 8-week randomized renewal experiment across 30,000 eligible accounts; measured a 1.4 percentage-point increase in conversion with a 95% confidence interval of 0.6 to 2.2 percentage points.
From the experienced example · use your own numbers
Partnered with operations to introduce a triage workflow; measured median review time falling from 19 to 15 minutes during a monitored rollout.
From the experienced example · use your own numbers
Statistics master’s graduate with a data science internship and projects in forecasting and classification. Uses Python, SQL and R to clean data, compare baselines and explain uncertainty.
New to data science · writing example
Data scientist with five years in insurance analytics. Connects model validation and controlled experiments to operational decisions, including a tested improvement in renewal conversion.
Experienced in industry · writing example
Quantitative researcher transitioning to industry data science, with experience in statistical modeling, reproducible analysis and collaborative research. Translates complex findings into clear decisions and documented limitations.
Moving from research · writing example
Statistics master’s graduate with an analytics internship and projects in demand forecasting and classification. Uses Python, SQL and R to test assumptions, compare baselines and communicate uncertainty.
From the entry level example
Data scientist with five years in insurance analytics, combining predictive modeling, experiment design and stakeholder communication. Evaluates model performance separately from measured operational results.
From the experienced example
Quantitative researcher transitioning to industry data science after doctoral and postdoctoral work. Builds reproducible statistical analyses, evaluates models and explains findings to collaborators with different technical backgrounds.
From the research example
Certified Analytics Professional (CAP), INFORMS, [year]
How to list it · copy the wording on your certificate
Professional Machine Learning Engineer, Google Cloud, [year]
How to list it · copy the wording on your certificate
AWS Certified Machine Learning Engineer – Associate, AWS, [year]
How to list it · copy the wording on your certificate
Databricks Certified Machine Learning Associate, Databricks, [year]
How to list it · copy the wording on your certificate
Intro to Machine Learning (completed course), Kaggle, [year]
How to list it · from the example resumes
Writing Functions in R (completed course), DataCamp, [year]
How to list it · from the example resumes
Skills are adapted from O*NET (15-2051.00) and the example resumes.
Where they go in your resume: Work historySkillsSummaryCertifications
Find skills that match your experience in Data scientist resume skills
Build a skills section around methods you have applied, with projects or work history to support them.
Build My ResumeOptional machine learning and analytics credentials
No license or certification is required to work as a data scientist. These optional machine learning and analytics credentials address particular methods or platforms; they do not replace demonstrated analytical work.
Tip: Choose optional credentials, then check the issuer’s eligibility and renewal rules.
Certified Analytics Professional (CAP)
INFORMS
- How to list it
- Certified Analytics Professional (CAP), INFORMS, [year]
- Eligibility or scope
- INFORMS offers the Certified Analytics Professional (CAP) credential at three levels. CAP-Essentials and CAP-Pro need no application and have no prerequisites; CAP-Expert requires an application, with education and experience criteria.
- Renewal or validity
- CAP-Expert holders recertify with 30 PDUs every three years; CAP-Pro and CAP-Essentials holders recertify by retesting or upgrading every five years.
Professional Machine Learning Engineer
Google Cloud
- How to list it
- Professional Machine Learning Engineer, Google Cloud, [year]
- Eligibility or scope
- The exam has no prerequisites. Google Cloud recommends 3+ years of industry experience, including at least 1 year designing and managing solutions on Google Cloud.
- Renewal or validity
- Check the issuer’s current maintenance requirements.
AWS Certified Machine Learning Engineer – Associate
AWS
- How to list it
- AWS Certified Machine Learning Engineer – Associate, AWS, [year]
- Eligibility or scope
- AWS describes the intended candidate as having at least 1 year of experience with Amazon SageMaker AI, Amazon Bedrock and other AWS machine learning engineering services, and lists data scientist among its candidate role examples.
- Renewal or validity
- The AWS Certified Machine Learning Engineer – Associate certification is valid for 3 years.
Databricks Certified Machine Learning Associate
Databricks
- How to list it
- Databricks Certified Machine Learning Associate, Databricks, [year]
- Eligibility or scope
- The exam has no prerequisites, though Databricks highly recommends related training and suggests 6+ months of hands-on experience with the machine learning tasks in its exam guide.
- Renewal or validity
- The certification is valid for 2 years; to recertify, holders take the current version of the exam.
Still studying? Show how the work fits
Prepare for the work the credential assesses
Check which credentials you hold against Data scientist certifications
Start with your analysis and results, then add relevant credentials to your resume with their full names and issuers.
Build My ResumeWhat a data scientist’s workday is like
O*NET’s work-context responses describe communication, accuracy and decision making in data scientists’ work. Use each pattern to prepare a specific interview example or a question about the team.
Tip: Prepare an example of communicating uncertainty to someone who needed to make a decision.
96% report using email every day.
Describe how a written explanation helped colleagues understand an analysis.
4.2 / 5 mean importance rating for being exact or accurate.
Describe a data check that caught an error before it affected model evaluation.
4.04 / 5 mean rating for freedom to make decisions.
Ask: Which modeling decisions would I own, and which would require a team review?
O*NET OnLine, Data Scientists. O*NET 31.0 Database; rows updated August 2026, with 25 respondents for each of the email, accuracy and decision-freedom figures. Interview and resume prompts are editorial. Accuracy ratings run from 1 (not important at all) to 5 (extremely important); decision-freedom ratings run from 1 (no freedom) to 5 (a lot of freedom).
Add a resume example of a data check, written explanation or modeling decision that helped your team.
Build My ResumeWhere a data scientist career can lead
Decide what you want to own next: model evaluation, experiments, operational use or recommendations to stakeholders.
Grow as a data scientist
- Develop stronger evaluation practice by reviewing baselines, validation design and model limitations.
- Take responsibility for an analysis from the initial stakeholder question through the recommendation.
- Build experience explaining tradeoffs and reviewing analytical work with colleagues.
Tip: Demonstrate broader responsibility through experiment design, model review and decisions made with stakeholders.
Compare related artificial intelligence jobs
| Job | Median pay | Typical entry education |
|---|---|---|
| Data scientists (this page) | $120,230 | Bachelor's degree |
| Economists | $124,720 | Master's degree |
| Actuaries | $130,000 | Bachelor's degree |
| Software developers, quality assurance analysts, and testers | $134,040 | Bachelor's degree |
| Computer and information research scientists | $140,300 | Master's degree |
Pay gaps don’t show a typical career move, and each job has its own requirements. Compare with data scientist pay in your state.
Source: U.S. Bureau of Labor Statistics, median annual pay, May 2025 · checked Oct 23, 2026
Choose the responsibility you want next and highlight resume examples of evaluation, collaboration or analytical ownership that support it.
Build My ResumeData scientist salary and job outlook
Government estimates for May 2025. Pay depends on your state, work setting and experience.
Tip: BLS counts business intelligence analysts and clinical data managers in this occupation’s pay, job and growth figures.
Data scientist pay by state
Median annual wage, May 2025. Highest of the 48 states and DC with published pay: Washington, $163,350. Tap a state to see its numbers.
- Under $92,000
- $92,000–$99,999
- $100,000–$105,999
- $106,000–$125,999
- $126,000 or more
- No data
Selected state
California
- Median
- $141,590
- Average
- $156,000
- Lowest to highest 10%
- $77,480 – $224,920
- Jobs in the state
- 39,310
National median: $120,230. State figures are annual; see the national pay range for hourly wages.
See all 49 areas
| State | Median | Average | Lowest 10% | Highest 10% | Jobs |
|---|---|---|---|---|---|
| Alabama | $103,120 | $105,180 | $59,130 | $161,590 | 1,740 |
| Alaska | $84,110 | $89,810 | $51,550 | $138,400 | 230 |
| Arizona | $107,240 | $111,950 | $65,200 | $161,730 | 4,560 |
| Arkansas | $109,390 | $116,320 | $67,090 | $169,110 | 530 |
| California | $141,590 | $156,000 | $77,480 | $224,920 | 39,310 |
| Colorado | $117,400 | $126,800 | $74,470 | $189,630 | 6,280 |
| Connecticut | $126,340 | $129,850 | $75,700 | $204,680 | 1,760 |
| District of Columbia | $126,490 | $142,580 | $89,750 | $209,730 | 2,680 |
| Florida | $115,820 | $119,150 | $63,080 | $174,140 | 10,240 |
| Georgia | $104,340 | $115,940 | $67,750 | $170,010 | 9,260 |
| Hawaii | $102,130 | $118,940 | $77,270 | $172,870 | 300 |
| Idaho | $89,380 | $110,220 | $63,980 | $169,010 | 1,350 |
| Illinois | $106,560 | $117,870 | $68,810 | $168,880 | 10,520 |
| Indiana | $91,470 | $98,340 | $58,750 | $141,250 | 3,580 |
| Iowa | $95,830 | $98,100 | $56,070 | $146,700 | 2,300 |
| Kansas | $98,130 | $105,080 | $60,520 | $154,990 | 490 |
| Kentucky | $91,760 | $100,840 | $61,990 | $156,480 | 1,540 |
| Louisiana | $78,760 | $88,480 | $53,050 | $128,210 | 1,300 |
| Maine | $90,880 | $97,500 | $60,280 | $138,530 | 1,210 |
| Maryland | $136,370 | $144,080 | $77,930 | $213,270 | 3,340 |
| Massachusetts | $131,750 | $136,460 | $81,030 | $206,220 | 9,420 |
| Michigan | $100,590 | $105,890 | $60,830 | $162,670 | 7,360 |
| Minnesota | $128,800 | $126,290 | $65,730 | $179,640 | 4,020 |
| Mississippi | $69,490 | $79,290 | $43,940 | $125,990 | 440 |
| Missouri | $97,090 | $100,880 | $58,960 | $151,380 | 4,730 |
| Montana | $100,490 | $108,170 | $67,120 | $167,150 | 220 |
| Nebraska | $98,230 | $98,980 | $66,230 | $133,140 | 1,980 |
| Nevada | $98,540 | $108,340 | $57,150 | $164,110 | 1,680 |
| New Hampshire | $100,620 | $109,880 | $73,480 | $155,020 | 1,100 |
| New Jersey | $135,280 | $138,590 | $80,720 | $203,950 | 6,430 |
| New Mexico | $95,850 | $94,160 | $49,990 | $133,660 | 560 |
| New York | $130,460 | $137,690 | $73,330 | $214,080 | 23,970 |
| North Carolina | $119,090 | $121,270 | $65,970 | $172,830 | 11,430 |
| North Dakota | $81,900 | $87,570 | $59,030 | $126,710 | 210 |
| Ohio | $102,630 | $107,160 | $61,710 | $160,650 | 6,100 |
| Oklahoma | $86,310 | $94,950 | $58,690 | $145,580 | 1,900 |
| Oregon | $125,990 | $131,300 | $78,110 | $206,550 | 2,140 |
| Pennsylvania | $106,850 | $110,810 | $63,340 | $162,290 | 13,810 |
| Rhode Island | $102,440 | $111,260 | $75,310 | $158,820 | 1,160 |
| South Carolina | $91,990 | $102,830 | $61,600 | $156,000 | 3,750 |
| South Dakota | $96,150 | $102,450 | $67,510 | $145,510 | 220 |
| Tennessee | $100,330 | $105,200 | $60,200 | $156,160 | 2,790 |
| Texas | $122,090 | $119,710 | $64,540 | $170,780 | 25,860 |
| Utah | $108,090 | $114,880 | $60,680 | $167,890 | 4,360 |
| Vermont | $127,070 | $123,640 | $76,570 | $160,430 | 200 |
| Virginia | $126,430 | $134,590 | $76,420 | $207,890 | 8,920 |
| Washington | $163,350 | $158,040 | $79,930 | $220,040 | 9,600 |
| West Virginia | $85,090 | $90,730 | $57,500 | $125,100 | 390 |
| Wisconsin | $106,680 | $116,600 | $76,300 | $168,810 | 4,370 |
Source: U.S. Bureau of Labor Statistics, Occupational Employment and Wage Statistics, May 2025 · checked Oct 23, 2026 · lowest and highest 10% are the 10th and 90th percentile wages
National pay range
Annual wages for all U.S. data scientists
| Percentile | Annual | Hourly |
|---|---|---|
| 10th | $67,240 | $32.33 |
| 25th | $85,660 | $41.18 |
| Median | $120,230 | $57.80 |
| 75th | $158,880 | $76.39 |
| 90th | $199,130 | $95.74 |
Source: U.S. Bureau of Labor Statistics, Occupational Employment and Wage Statistics, May 2025 · checked Oct 23, 2026
More pay data: state rankings and pay by work setting
State rankings
Top five among states and DC with published figures
Source: U.S. Bureau of Labor Statistics, Occupational Employment and Wage Statistics, May 2025 · checked Oct 23, 2026 · ranked by annual mean wage or jobs per 1,000 jobs
Median pay by work setting
Annual median, May 2025
- Publishing, broadcasting, and content providers$142,240
- Computer systems design and related services$132,380
- Credit intermediation and related activities$129,490
- Management of companies and enterprises$128,050
- Insurance carriers and related activities$108,650
Source: Occupational Outlook Handbook, May 2025 · checked Oct 23, 2026
Projected job growth, 2025–35
Change in employment over ten years
- Data scientists35%
- Mathematical science occupations25%
- All occupations3%
That's 95,400 more jobs over ten years and about 24,800 openings a year, counting people who retire or change jobs.
Source: U.S. Bureau of Labor Statistics, Employment Projections 2025–35 · checked Oct 23, 2026
Where data scientists work
Share of the 275,600 jobs in 2025 (largest settings)
- Publishing, broadcasting, and content providers12%
- Computer systems design and related services10%
- Insurance carriers and related activities10%
- Management of companies and enterprises10%
- Credit intermediation and related activities6%
The rest work in other settings.
Source: Occupational Outlook Handbook · checked Oct 23, 2026
Use the pay context to compare roles, then tailor your resume to the domain and responsibilities of your chosen job.
Build My ResumeAbout this guide
Updated November 13, 2026.
Sources
Loading industries…
Build your data scientist resume
Build your resume around an analysis you can explain: the question, method, result and contribution. Add the skills and education that support it.